
Why Tampa will be 2022's Hottest Market
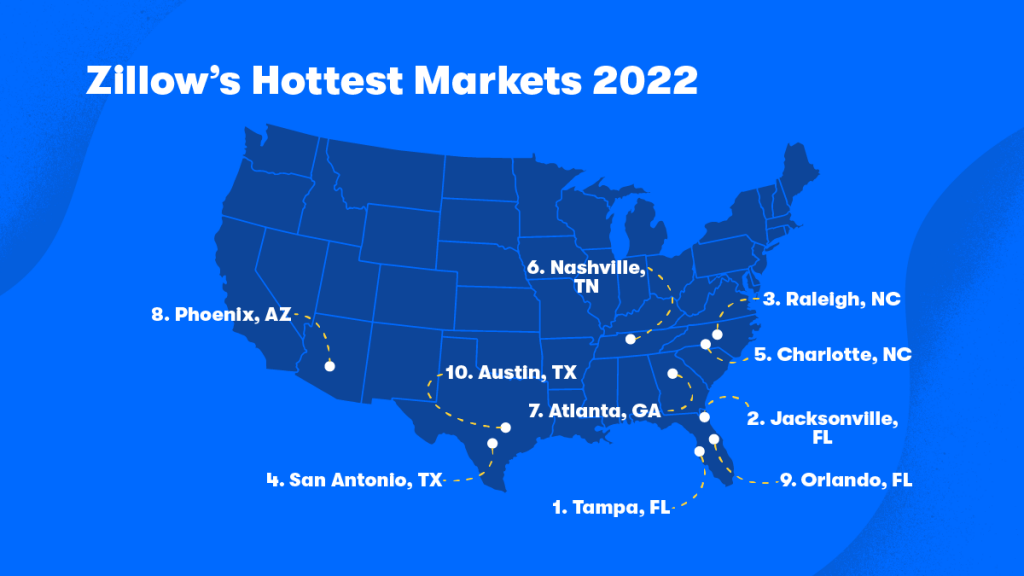
- The Sun Belt dominates Zillow’s list of hottest housing markets for the second year in a row. Tampa, Jacksonville, Raleigh, San Antonio and Charlotte are expected to lead the U.S.
- Last year’s hottest market, Austin, fell to No. 10 this year.
- New York, Milwaukee, San Francisco and Chicago are expected to be the coolest housing markets in 2022, but sellers will have the upper hand even in cooler markets.
The housing market in 2022 is expected to remain hot overall, with many of the same trends that drove the market to new heights this year still firmly in place as we head into the New Year. But while all of the nation’s 50 largest markets are expected to grow healthily in 2022 and sellers nationwide should expect to remain in the driver’s seat, there can be only one Number One – and Zillow expects Tampa to top the list, with a host of relatively affordable and fast-growing Sun Belt markets following closely behind.
Jacksonville, Raleigh, San Antonio and Charlotte fill out the list of the top five hottest markets for 2022, each buoyed by a combination of strong forecasted home value growth, strong economic fundamentals including high job growth, fast-moving inventory and plentiful likely buyers. Additionally, these markets have historically not been particularly sensitive to rising mortgage interest rates or a slowing stock market – two risk factors for housing and the economy overall as the calendar turns.
The coolest markets of the year are expected to be New York, Milwaukee, San Francisco, Chicago, and San Jose – each characterized by relatively fewer new jobs and less favorable demographic trends than other large markets, though still all expected to fare just fine on their own next year.
Price Growth
Home value growth in 2021 consistently broke records, both nationally and in many local markets. This growth has been fueled by historically low mortgage interest rates, pandemic-influenced decisions on where households want to live, and demographic shifts – both from aging millennials and retiring/downsizing boomers – that have all combined to keep housing demand very high. At the same time, inventory of available housing has been limited, as builders play catch-up after years of underbuilding and sellers list their homes in fewer numbers. None of those trends is expected to change much in 2022 from 2021, and limited housing supply coupled with sky-high housing demand is a classic Econ 101 recipe for rising home values.
That said, many of the fastest growing markets in 2021 are expected to slow somewhat in 2022, making way at the top for other markets. Tampa is expected to rise from fourth-fastest home value growth in 2021 to fastest in 2022, Raleigh from third to second and Jacksonville from seventh to third. The fastest-growing markets in 2021, Austin and Phoenix, are expected to fall to seventh and eighth, respectively.
Inventory & Velocity
Both restrictive supply overall – fewer sellers willing to sell, fewer homes built by builders – and sky-high demand can both lead to low inventory. The former is probably self-explanatory, but the latter is also interesting: When demand is very high, even a decent number of homes on the market can still sell very quickly given a high number of buyers, contributing to an overall low level of homes on the market at any given time even if the pace of new listings is healthy. And when new listings are quickly snatched up, it’s likely that means some buyers were left out, either moving too slow to secure a home while it was on the market, or not being able or willing to make a competitive enough offer.
We can see where buyers had the hardest time finding a home in 2021, and so where there may be the most pent up demand in 2022. The fewest (standardized) listing days per home were in New Orleans, Cleveland, and Kansas City. These markets are forecast to have less deceleration than most other markets as well.
Job Market & Building
Total nonfarm payrolls stood 2.1%, 3.1 million jobs, lower this November than in November 2019. At the same time (November 2019 to October 2021), 3.1 million new housing units were authorized by building permits. So nationally, we have lost almost exactly one job for every new housing unit built. As the labor market recovers, several major metros have actually added more jobs than new units – despite the pandemic. Tampa added 0.63 added jobs per new unit, second only to Salt Lake City at 0.99 added jobs per new unit. Also with job gains were Phoenix, Austin, Jacksonville, Dallas, Raleigh, and San Antonio.
Demographics
Baby Boomers and millennials represent two enormous generations, both very active in the housing market. Boomers are hardly exiting the market as they age, staying active and purchasing homes in the Sun Belt as they retire and/or move to be closer to grandchildren etc. And millennials are just beginning to age into their prime home buying years as they hit their early-mid thirties, a time when many Americans traditionally begin to settle down, start families and think differently about the type of home and type of community they want and need.
The boomer tide in the for-sale housing market is expected to continue to rise for at least the next 8 years; younger millennials will be hitting first-time home buying age at about the same time, meaning the 2020’s will be a period of sustained underlying demand in the housing market. Year by year these effects will be felt differently across markets. In 2022, the market with the most demographic lift in the for-sale market is Austin, with a trend suggesting the formation of 3.4% more owning households (assuming there are homes available for them to buy). Orlando follows at 2.8%, and then Tampa at 2.7%. Of the largest 50 markets, 29 have natural owner household growth exceeding 1% in one year, the rule-of-thumb rate at which the housing stock increases nationally. The markets with the least demographic pressure for growth are Pittsburgh, Hartford and Buffalo.
Risks
There are two large known risk factors for housing markets in 2022. First, mortgage interest rates are expected to rise in 2022, making home loans more expensive for aspiring buyers. At the margin, this would restrict the inventory accessible in the most expensive markets, potentially driving up competition for the lowest-priced homes in those markets or removing them from consideration altogether. Historically, home value appreciation in the following markets has strong negative correlation with interest rates — so if interest rates go up, these markets are likely to slow the most: San Diego, New Orleans, Washington DC, Los Angeles, San Jose and San Francisco.
Second, forecasts on the performance of stocks are incredibly wide, with analysts’ 2022 year-end targets ranging from -7% to +13%, slower growth in any case than what we’ve seen in the last 2 years if not declines. A slower stock market would mean buyers are bringing relatively less to the table for a down payment in 2022. This would most affect markets where there are a lot of first time buyers or where more buyers are entering from lower cost areas, bringing less equity from their previous home. (Or if housing is treated as an asset it could mean a substitution to housing in the next few months. What follows addresses only the downside risk.) In the following markets, growth has strong positive correlation with stock market returns — so if the stock market falters next year, we’d expect home value growth in these places to slow disproportionately: Phoenix, Las Vegas, Cincinnati, Hartford, St. Louis, Miami, Cleveland, Los Angeles and San Jose.
Methodology
The final index was based on the following data:
- Forecasted annual home value appreciation in Nov. 2022
- Forecasted acceleration in home value appreciation, Nov. 2021-Nov. 2022
- Standardized listing days per home, Jan. 2021-Nov. 2021
- 2-year change in total non-farm employment per 2-year residential building permit total
- Projected change in owner households, 2021-2022
Metrics were normalized given the available metro-level data to standard deviations from the mean, with mean and standard deviation weighted based on housing unit counts. Standard scores were capped at ±1.96 so as not to overly penalize any metro for extreme data points. The final index was reached by taking the average across metrics, with standardized HPA acceleration down-weighted by half.
Home values and expected home value growth were taken from published Zillow Home Value Index and Zillow Home Value Forecast data available at the time of analysis (data through November 2021 and forecast data through November 2022 was the latest available).
Inventory and velocity are represented by standardized listing days per home, using published Zillow data for Median Days to Pending and New Listings. Similar to a metric of inventory, this will capture both the number of homes and speed of sale. However, markets differ structurally such that time on market is not always directly comparable for gauging relative market heat. To correct for these differences we adjust Median Days to Pending using pre-COVID region fixed effects. Then we multiply by new listings to get standardized listing days, and then divide by the total number of homes to put metros of different sizes on the same scale.
Job market and building data took the ratio of the change in employment to the total permitted residential structures. Total non-farm employment (seasonally adjusted) comes from the U.S. Bureau of Labor Statistics Current Employment Statistics survey. We used the 2-year change in employment Nov. 2019-Nov. 2021.
Building permit data comes from New Private Housing Structures Authorized by Building Permits (BPPRIVSA), retrieved from FRED, Federal Reserve Bank of St. Louis. We sum over the 2-year period Oct. 2019-Oct. 2021.
To assess the underlying demographic pressure in the for-sale housing market, we used the projected change in homeowner households 2021-2022. This projection accounted for population aging and migration patterns. Data came from the American Community Survey (2018 ACS 5-year sample, 2019 ACS 5-year sample, and 2019 ACS 1-year sample) downloaded from IPUMS USA, University of Minnesota, www.ipums.org.
In the first stage, we used the larger 5-year sample to calculate entry and exit from the population (due to birth, migration, death) by age. For each birth cohort the age-specific outflow was set to be the difference between the cohort’s population in 2019, less in-migration, and the cohort’s population in 2018. The population inflow and outflow divided by the population in 2018 yielded the rate of change entering their 2019 age.
In the second stage, we applied the age-specific rates of population change to the 1-year sample, iterating over 2020-2022. We filtered to ages 18-89 to avoid low population counts and unreliable migration trends at the highest ages. Keeping constant the observed age-specific share of the population who is the head of household of an owner-occupied housing unit (the “owner-headship rate”), we calculated the percentage change in the number of owner-heads expected in 2022, compared to 2021, by age. Summing these changes gave us a demographically expected rate of increase in homeowner households in 2022.
All population and owner-headship counts were smoothed across ages over a 5-year centered window prior to taking rates and changes.
[1]At the time of publication, the Zillow Home Value Forecast only covered the period ending November 2022. Throughout this piece, this data for the first 11 months of 2022, but not the full year, is used ass a proxy for full-year 2022 data.