January 25, 2023 by Dana Anderson and Lily Katz - Redfin News
Pending sales increased 3% in December from the month before, the first monthly gain since October 2021. But sellers remained on the sidelines, with new listings posting their biggest annual drop since the start of the pandemic.
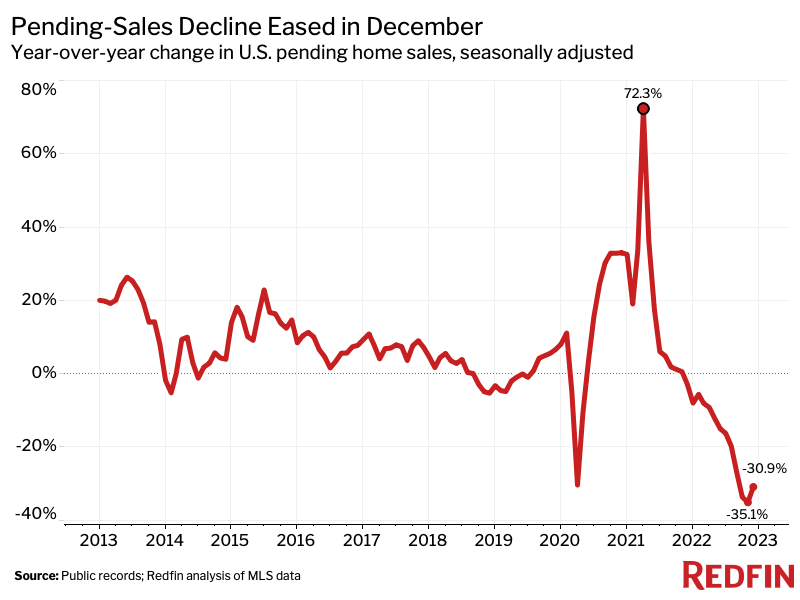
Seasonally adjusted pending home sales rose 2.9% nationwide in December, the first month-over-month increase since October 2021. Pending sales continued falling year over year, but the decline eased for the first time in 10 months—to 30.9% from a record 35.1% drop in November.
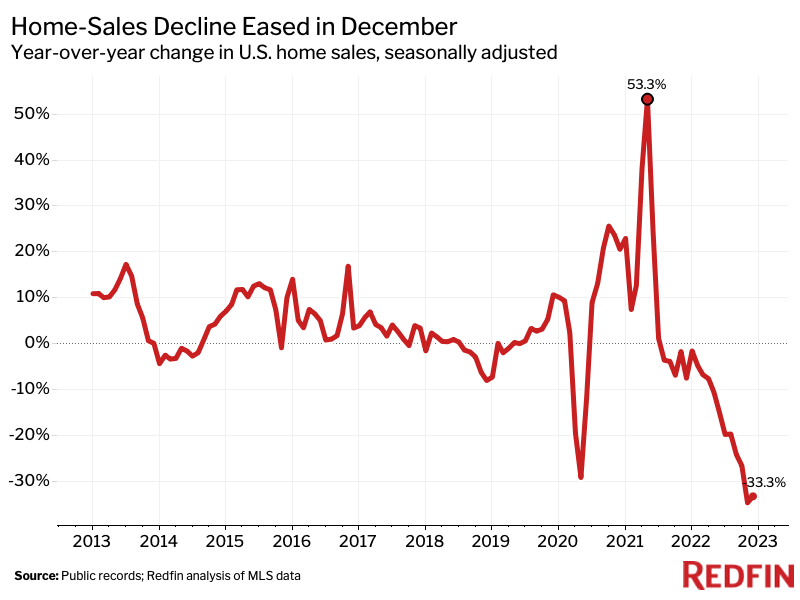
Closed home sales fell 33% from a year earlier, but that drop also eased from a record 35% decline in November. Still, far fewer homes are selling now than a year ago during the pandemic homebuying frenzy.
“The small uptick in pending sales suggests some homebuyers returned to the market at the tail end of 2022 after demand plummeted in the fall,” said Redfin Economics Research Lead Chen Zhao. “That’s mostly because slowing inflation has driven mortgage rates down to about 6% from a peak of over 7%, giving buyers some relief and sending the typical buyer’s payment down nearly $200. Along with the dollar decline in monthly payments, rates traveling down instead of up are helping some sidelined buyers get back into a house-hunting mindset.”
Some Redfin agents in certain areas have noticed homebuyer activity pick up since it stagnated in the fall. In Los Angeles, for instance, local agent Lindsay Katz has seen small bidding wars on fairly priced, move-in ready homes in desirable neighborhoods over the last few weeks, with the stabilization of mortgage rates giving buyers more confidence. But she said the lack of new listings means prospective buyers don’t have many options.
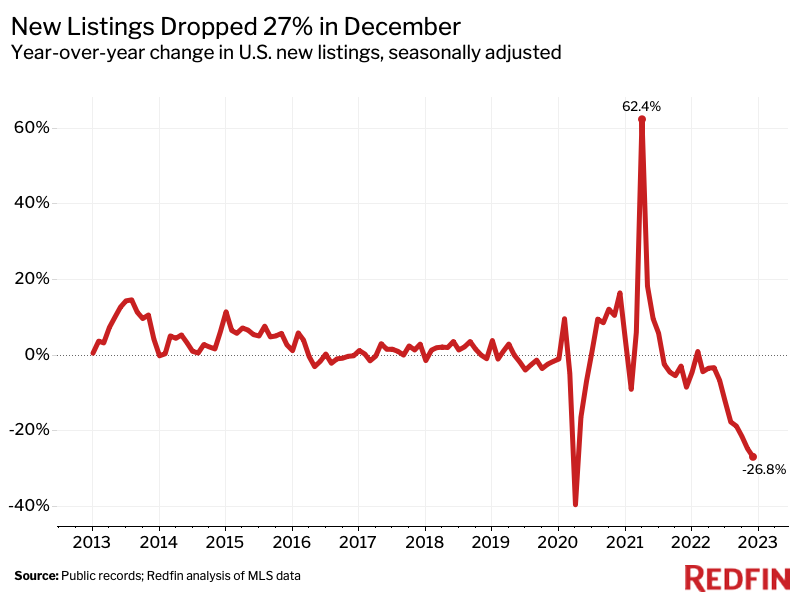
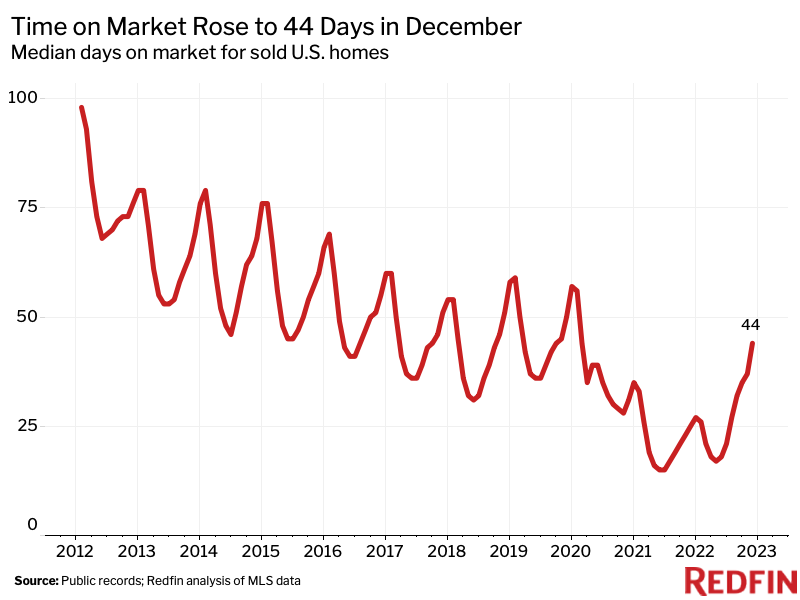
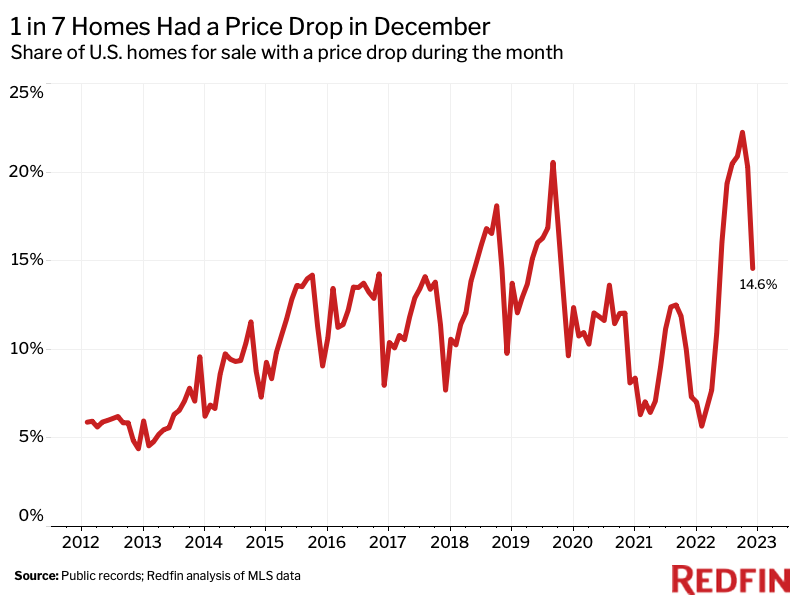
New listings fell 26.8% year over year in December, the most since the onset of the pandemic, with many homeowners keen to hold onto their low mortgage rates and/or reluctant to sell in a still-slow market. The typical home that sold was on the market for 44 days—nearly twice as long as a year earlier. Data from early January, however, suggests that some homeowners are noticing the uptick in buyer interest and warming up to listing their home for sale.
December Highlights
| December 2022 | Month-Over-Month Change | Year-Over-Year Change |
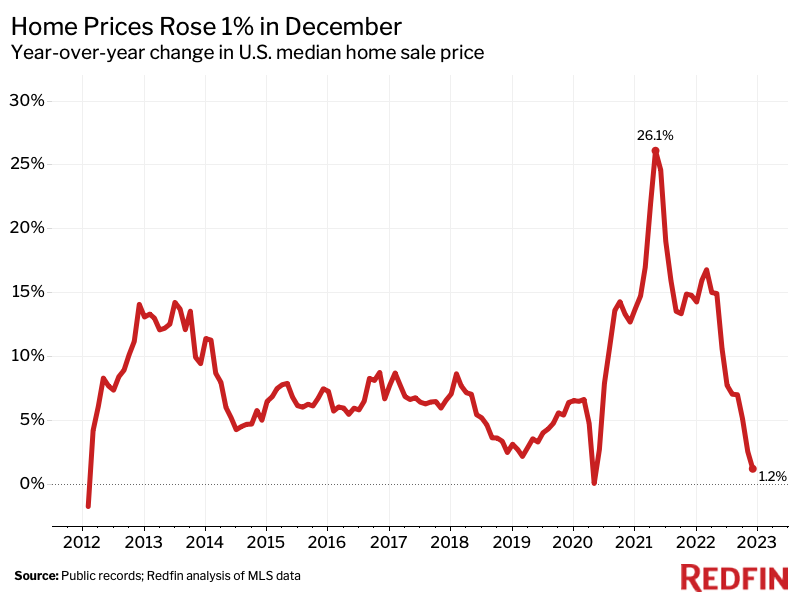
| Median sale price | $388,100 | -1.4% | 1.2% |
| Pending home sales, seasonally adjusted | 405,007 | 2.9% | -30.9% |
| Homes sold, seasonally adjusted | 402,908 | -4.4% | -33.3% |
| New listings, seasonally adjusted | 474,257 | -3.1% | -26.8% |
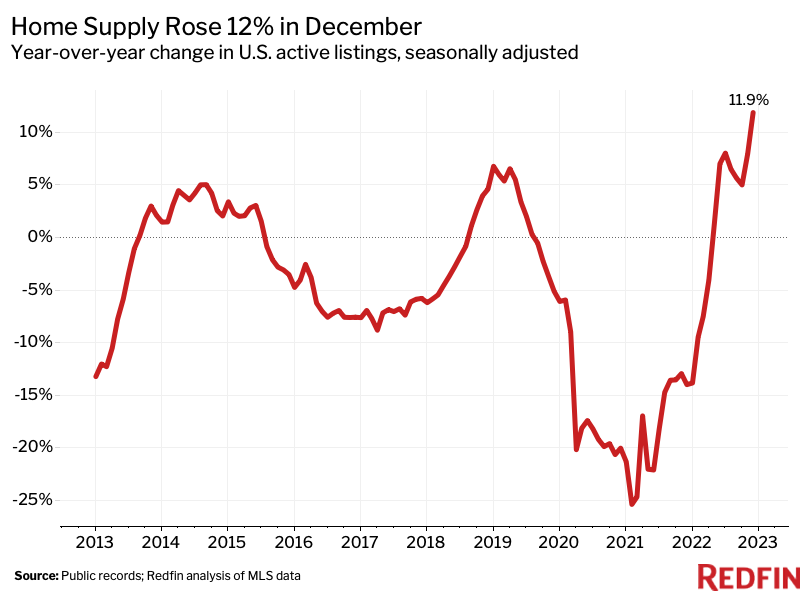
| All homes for sale, seasonally adjusted | 1,590,854 | 1.6% | 11.9% |
| Months of supply | 2.3 | -0.4 | 1.3 |
| Median days on market | 44 | 6 | 19 |
| Share of for-sale homes with a price drop | 14.6% | -5.7 ppts | 7.2 ppts |
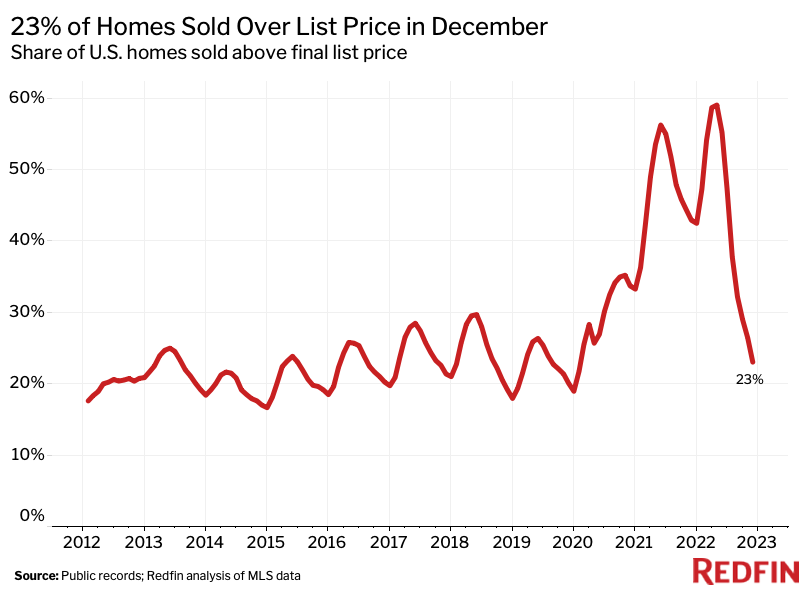
| Share of homes sold above final list price | 23% | -3.4 ppts | -19.9 ppts |
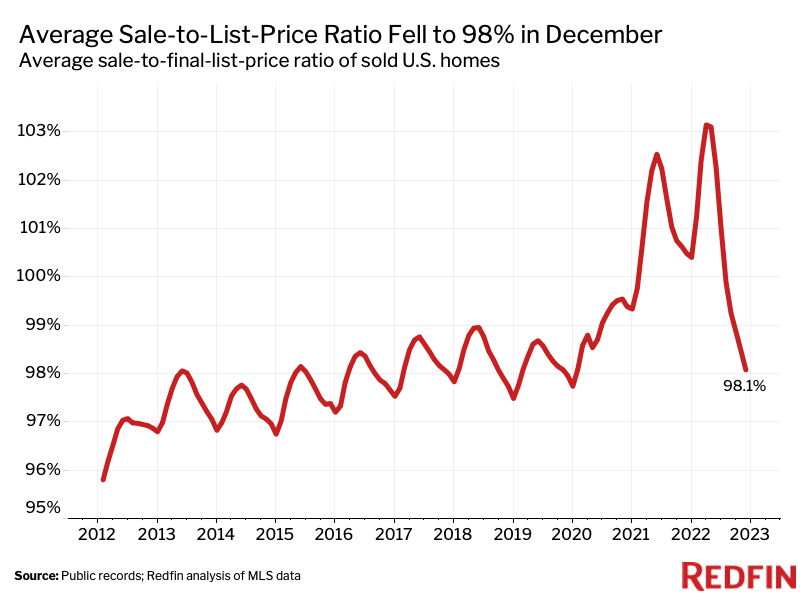
| Average sale-to-final-list-price ratio | 98.1% | -0.4 ppts | -2.4 ppts |
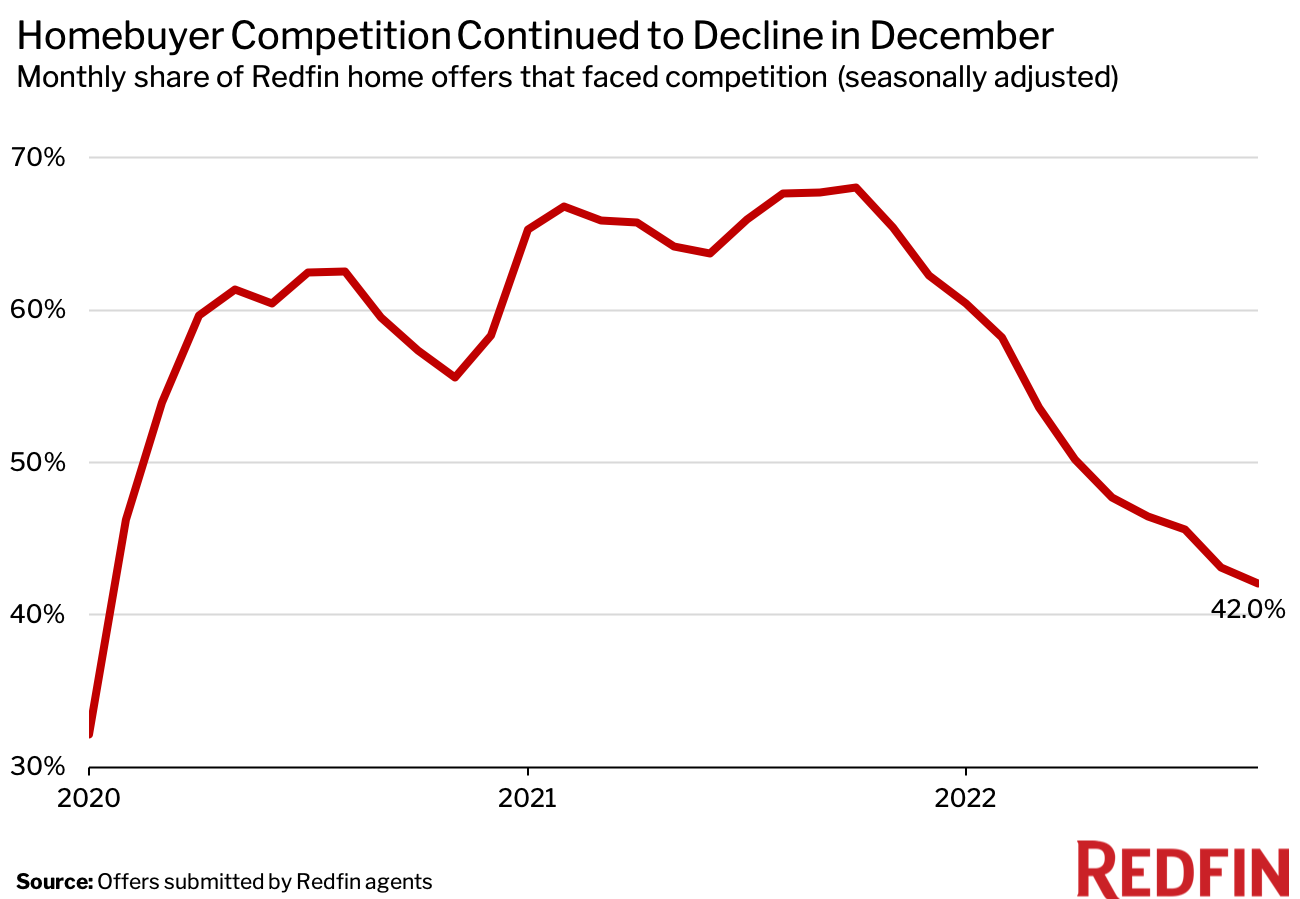
| Share of home offers written by Redfin agents that faced competition, seasonally adjusted | 42% | -1.1 ppts | -25.7 ppts |
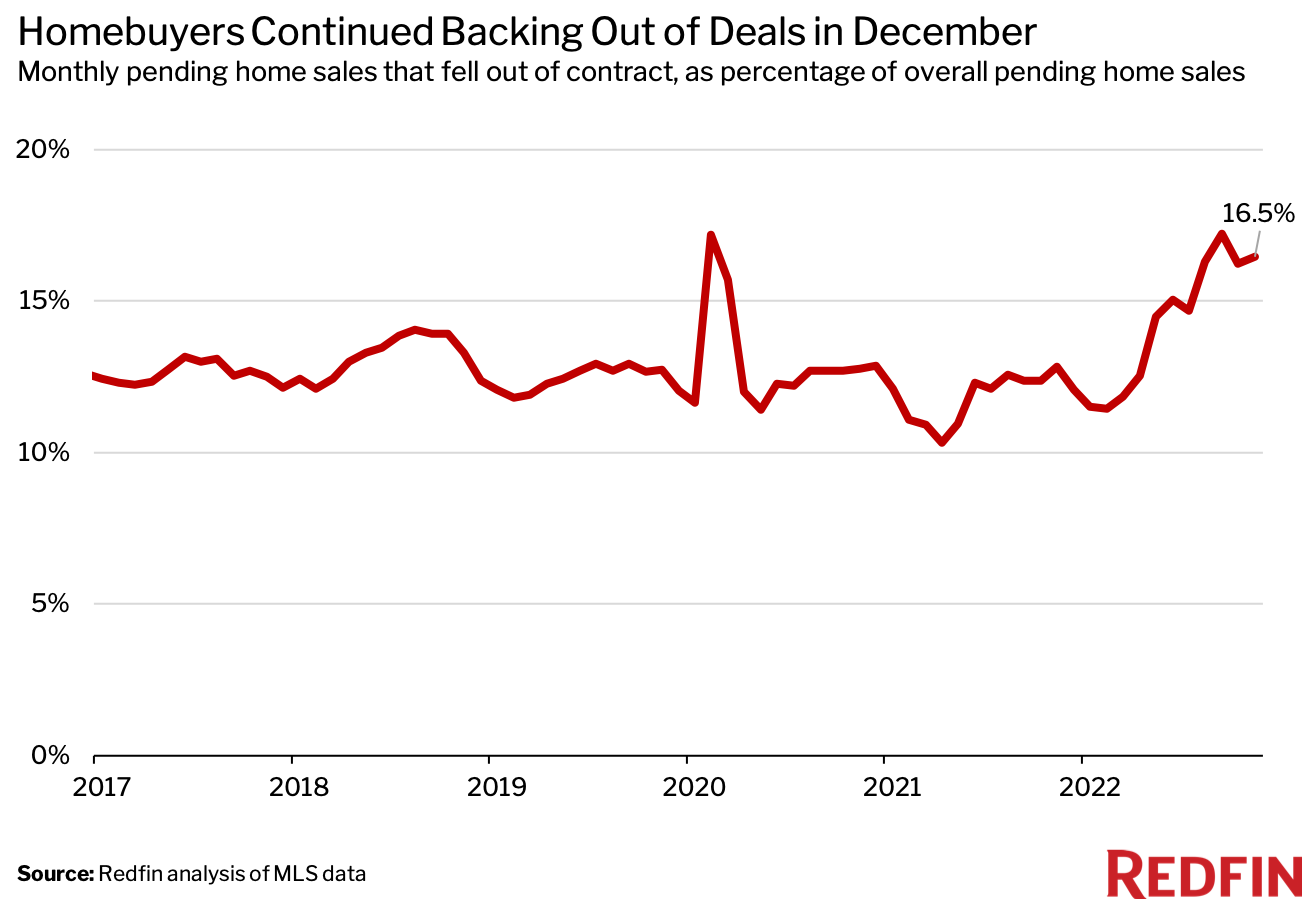
| Pending sales that fell out of contract, as % of overall pending sales | 16.5% | 0.2 ppts | 3.6 ppts |
| Average 30-year fixed mortgage rate | 6.36% | -0.45 ppts | 3.26 ppts |
Note: Data is subject to revision
Metro-Level Highlights: December 2022
Data in the bullets below came from a list of the 90 U.S. metro areas with populations of at least 750,000, unless otherwise noted. To find the full metro-level and national datasets, head to the monthly section of the Redfin Data Center. Refer to our metrics definition page for explanations of metrics used in this report. Metro-level data is not seasonally adjusted, unless otherwise noted.
- Home sales: In San Jose, pending sales rose 21% month over month on a seasonally adjusted basis—more than any other metro. Next came Anaheim (15.8%), Richmond, VA (15.5%), Albany, NY (13.1%) and Chicago (11.6%). On a year-over-year, unadjusted basis, only one metro saw an increase in pending sales: San Francisco (2.4%). The biggest decliners were Boise, ID (-77.5%), Baton Rouge, LA (-65.5%) and New Orleans (-52.8%).
- Prices: Median sale prices fell from a year earlier in 26 metros, led by San Francisco (-11.4%). Next came San Jose (-7.6%), Memphis, TN (-6.5%), Honolulu (-5.6%) and Detroit (-5.5%). The biggest increases were in Greensboro, NC (15.2%), El Paso, TX (12.9%), Rochester, NY (12.2%), Omaha, NE (10.4%) and Nashville, TN (9.9%).
- Listings: New listings fell the most from a year earlier in Boise (-57.4%), Greensboro (-52.2%), Tacoma, WA (-48.5%), Seattle (-48.2%) and Stockton, CA (-47.5%). They fell the least in McAllen, TX (-3.5%), Detroit (-7.6%), Albany, NY (-11%), North Port, FL (-11.8%) and Rochester (-13.9%).
- Supply: Active listings rose the most from a year earlier in North Port (79.5%), Seattle (59.5%), Nashville (56.5%), Tampa, FL (55.8%) and Fort Worth, TX (48.1%). They fell the most in Greensboro (-28.4%), Milwaukee (-28.4%), Hartford, CT (-28.4%), Bridgeport, CT (-26.3%) and New Haven, CT( -18%).
Scroll down for market-by-market breakdowns on competition and home-purchase cancellations, which aren’t in the Data Center.
Competition
Data below came from a list of 34 metros that had a monthly average of at least 50 offers submitted by Redfin agents from March 2021 to March 2022. An offer is considered part of a bidding war if a Redfin agent reported that it received at least one competing bid. The table is ranked from lowest December 2022 competition rate to highest.
| Metro Area | Dec. 2022: Share of Redfin Offers That Faced Competition | Nov. 2022: Share of Redfin Offers That Faced Competition | Dec. 2021: Share of Redfin Offers That Faced Competition |
| Austin, TX | 13.9% | 32.1% | 57.2% |
| Orlando, FL | 20.0% | 8.1% | 55.0% |
| San Antonio, TX | 20.0% | 33.3% | 53.0% |
| Phoenix, AZ | 21.3% | 17.8% | 48.2% |
| Miami, FL | 21.7% | 27.7% | 48.6% |
| Las Vegas, NV | 22.7% | 24.6% | 48.0% |
| Nashville, TN | 22.7% | 22.2% | 52.6% |
| Dallas, TX | 23.7% | 31.7% | 65.9% |
| Raleigh, NC | 23.8% | 28.6% | 63.3% |
| Seattle, WA | 24.2% | 25.3% | 70.6% |
| Tampa, FL | 26.3% | 16.7% | 66.7% |
| Riverside, CA | 26.4% | 25.0% | 46.7% |
| Portland, OR | 26.6% | 36.9% | 64.4% |
| Houston, TX | 29.6% | 22.3% | 45.2% |
| Sacramento, CA | 31.7% | 45.5% | 67.1% |
| Colorado Springs, CO | 35.7% | 41.7% | 62.9% |
| Denver, CO | 36.0% | 29.0% | 65.1% |
| Philadelphia, PA | 37.4% | 46.9% | 59.9% |
| Honolulu,HI | 38.5% | 14.3% | 72.1% |
| Chicago, IL | 39.9% | 38.7% | 47.9% |
| Charlotte, NC | 40.0% | 31.4% | 52.5% |
| San Francisco, CA | 40.4% | 50.7% | 68.1% |
| Washington, D.C. | 40.5% | 44.5% | 60.5% |
| New York, NY | 41.0% | 57.7% | 62.7% |
| Atlanta, GA | 42.3% | 41.9% | 61.9% |
| Los Angeles, CA | 44.9% | 48.4% | 72.6% |
| San Diego, CA | 48.1% | 43.5% | 72.5% |
| Boston, MA | 48.3% | 43.9% | 68.4% |
| Detroit, MI | 50.0% | 32.1% | 46.9% |
| Baltimore, MD | 50.9% | 48.6% | 64.3% |
| Worcester, MA | 52.4% | 55.6% | 59.4% |
| San Jose, CA | 57.6% | 60.5% | 75.3% |
| Minneapolis, MN | 57.9% | 42.9% | 54.2% |
| Providence, RI | 63.2% | 62.5% | 57.1% |
| National—U.S.A. (seasonally adjusted) | 42% | 43.1% | 67.7% |
Note: Metro-level competition data is not seasonally adjusted.
Home-Purchase Cancellations
Data below came from a list of the 50 most populous metro areas and is ranked from highest percentage of cancellations in December 2022 to lowest.
| Metro Area | Dec. 2022: Pending Sales That Fell Out of Contract, as % of Overall Pending Sales | Nov. 2022: Pending Sales That Fell Out of Contract, as % of Overall Pending Sales | Dec. 2021: Pending Sales That Fell Out of Contract, as % of Overall Pending Sales |
| Jacksonville, FL | 25.6% | 25.2% | 19.2% |
| Atlanta, GA | 23.4% | 23.1% | 7.8% |
| Fort Lauderdale, FL | 21.1% | 21.4% | 20.2% |
| Tampa, FL | 20.7% | 22.1% | 21.2% |
| Houston, TX | 20.7% | 21.0% | 19.9% |
| Cleveland, OH | 20.6% | 19.2% | 20.6% |
| Fort Worth, TX | 20.3% | 20.3% | 17.4% |
| Dallas, TX | 20.0% | 21.9% | 17.5% |
| Riverside, CA | 19.6% | 19.2% | 17.0% |
| Orlando, FL | 19.5% | 22.4% | 21.4% |
| Denver, CO | 19.3% | 18.3% | 7.4% |
| Phoenix, AZ | 19.0% | 18.7% | 17.2% |
| Chicago, IL | 18.8% | 17.8% | 16.6% |
| Miami, FL | 18.6% | 18.3% | 15.6% |
| Las Vegas, NV | 18.6% | 20.8% | 21.4% |
| West Palm Beach, FL | 18.4% | 17.6% | 18.5% |
| Detroit, MI | 17.9% | 16.1% | 15.7% |
| Indianapolis, IN | 17.3% | 18.8% | 16.4% |
| Pittsburgh, PA | 17.2% | 17.7% | 17.1% |
| Columbus, OH | 17.2% | 18.4% | 15.8% |
| Sacramento, CA | 17.2% | 17.5% | 14.2% |
| St. Louis, MO | 17.1% | 15.6% | 15.6% |
| Austin, TX | 16.1% | 17.3% | 12.8% |
| Portland, OR | 15.9% | 16.8% | 14.5% |
| Nashville, TN | 15.9% | 16.3% | 15.6% |
| Virginia Beach, VA | 15.8% | 14.6% | 15.3% |
| Anaheim, CA | 15.8% | 14.4% | 11.9% |
| Washington, DC | 15.4% | 13.6% | 12.3% |
| San Antonio, TX | 15.0% | 12.6% | 19.9% |
| Kansas City, MO | 15.0% | 17.2% | 16.3% |
| Baltimore, MD | 14.9% | 13.3% | 14.1% |
| Los Angeles, CA | 14.8% | 17.7% | 13.7% |
| Cincinnati, OH | 14.2% | 15.6% | 16.1% |
| Providence, RI | 14.1% | 12.2% | 13.1% |
| Charlotte, NC | 14.0% | 14.8% | 12.0% |
| New Brunswick, NJ | 13.7% | 13.2% | 8.9% |
| San Diego, CA | 13.6% | 16.5% | 13.5% |
| Philadelphia, PA | 13.5% | 14.7% | 12.0% |
| Warren, MI | 13.2% | 13.3% | 11.0% |
| Seattle, WA | 12.6% | 12.4% | 7.8% |
| Milwaukee, WI | 12.1% | 11.3% | 11.2% |
| Boston, MA | 12.0% | 11.8% | 10.9% |
| Oakland, CA | 11.7% | 8.7% | 6.7% |
| Newark, NJ | 11.5% | 12.4% | 1.7% |
| Montgomery County, PA | 10.9% | 9.5% | 11.2% |
| Minneapolis, MN | 10.2% | 11.9% | 10.2% |
| New York, NY | 9.4% | 8.4% | 5.2% |
| San Jose, CA | 7.5% | 8.6% | 5.2% |
| Nassau County, NY | 5.7% | 7.2% | 4.4% |
| San Francisco, CA | 4.1% | 6.3% | 2.6% |
| National—U.S.A. | 16.5% | 16.2% | 12.8% |
As a data journalist at Redfin, Dana Anderson writes about the numbers behind real estate trends. Redfin is a full-service real estate brokerage that uses modern technology to make clients smarter and faster. For more information about working with a Redfin real estate agent to buy or sell a home, visit our Why Redfin page.
Email DanaAs a data journalist, Lily is passionate about helping readers understand complex facets of the housing market. She is particularly interested in the issues of climate change, race and gender equality and housing affordability. Prior to working at Redfin, Lily spent four years as a reporter at Bloomberg News in New York City.
Email Lily
