
Realtor.com - by Hannah Jones
DATA, ECONOMIC COVERAGE, HOUSING SUPPLY
Feb 27, 2024
Highlights:
- US housing markets continue to struggle with a growing shortage of new homes, the result of more than a decade of under-building relative to population growth.
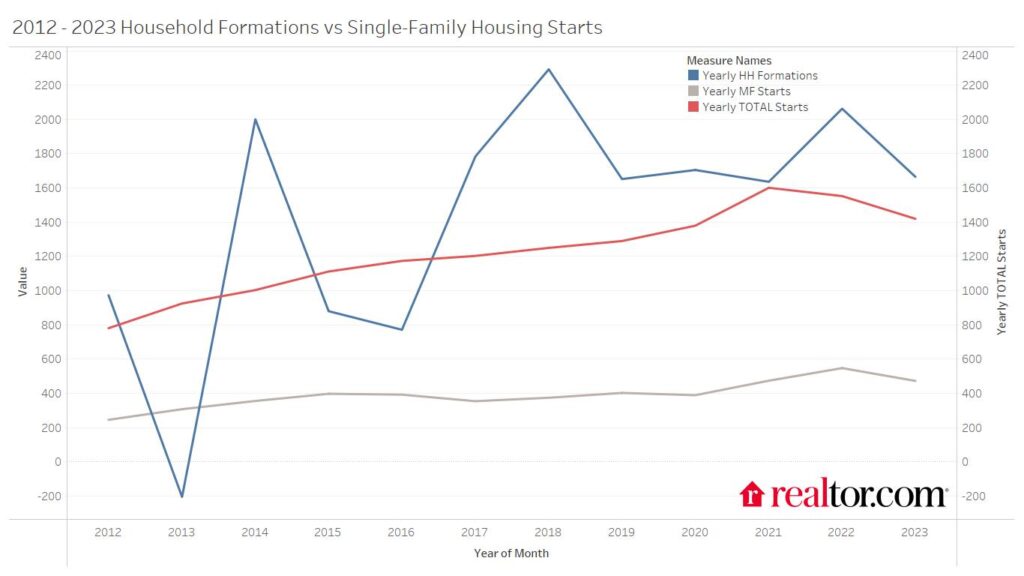
- In 2023, the U.S. saw 1.67 million household formations, resulting in 17.2 million household formations between 2012 and 2023. In this time period, 14.7 million housing units were started, and 13.4 million were completed.
- The total housing starts count includes 9.98 million single-family and 4.71 million multi-family homes. Housing completions include 9.5 million single-family homes and 3.9 million multi-family homes.
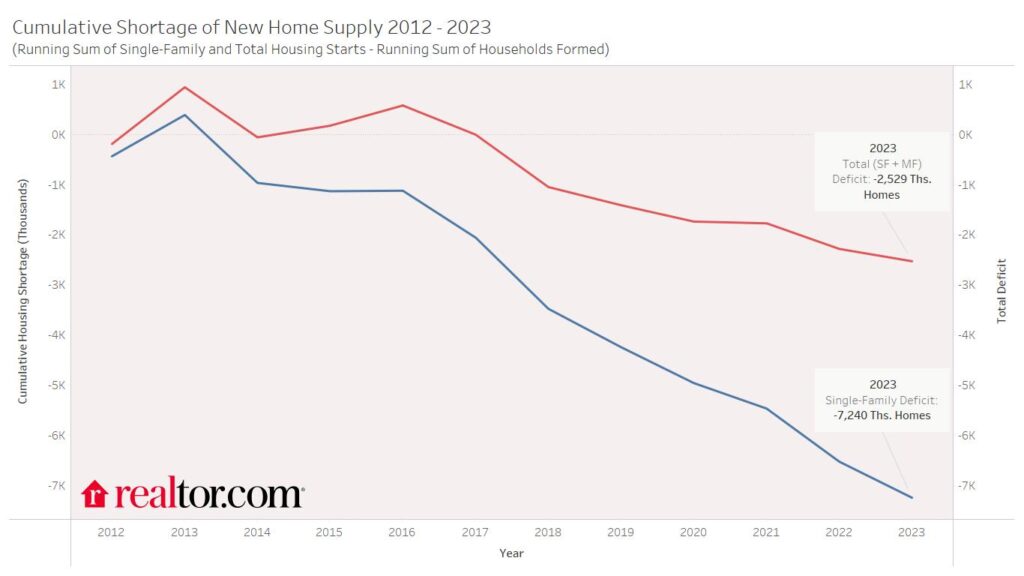
- The gap between single-family home constructions and household formations grew to 7.2 million homes between 2012 and 2023. However, including multi-family home construction reduces this gap to 2.5 million homes.
- Multi-family home construction fell as a share of all home starts in 2023, but remained above 2017-2021 levels.
- The rate of overall housing starts slowed in 2023 while completions climbed.
- In 2023, roughly 947,200 single-family homes were started, which is 5.8% fewer than in 2022, though still more than in any other single year back to 2010.
- Multi-family home starts settled to 472,700 starts, down 13.6% compared to 2022, but still up 22.7% compared to the 2012-2022 average.
- In 2023, 1.5 million housing units were completed (+4.5% YY), including 1 million single-family units (-1.9% YY) and 450,100 multi-family units (+22.2% YY). The overall number of home completions and the rate of multifamily home completion were both the highest since 2007 and 1987, respectively.
- Household growth has outpaced single-family home permits in 73 of the top 100 US metros.
- Household formations have outpaced overall (single- and multi-family) permitting activity most significantly in fast-growing sunbelt metros such as Deltona-Daytona Beach-Ormond Beach, FL, San Antonio-New Braunfels, TX and Palm Bay-Melbourne-Titusville, FL.
The Housing Market Ambled Along in 2023
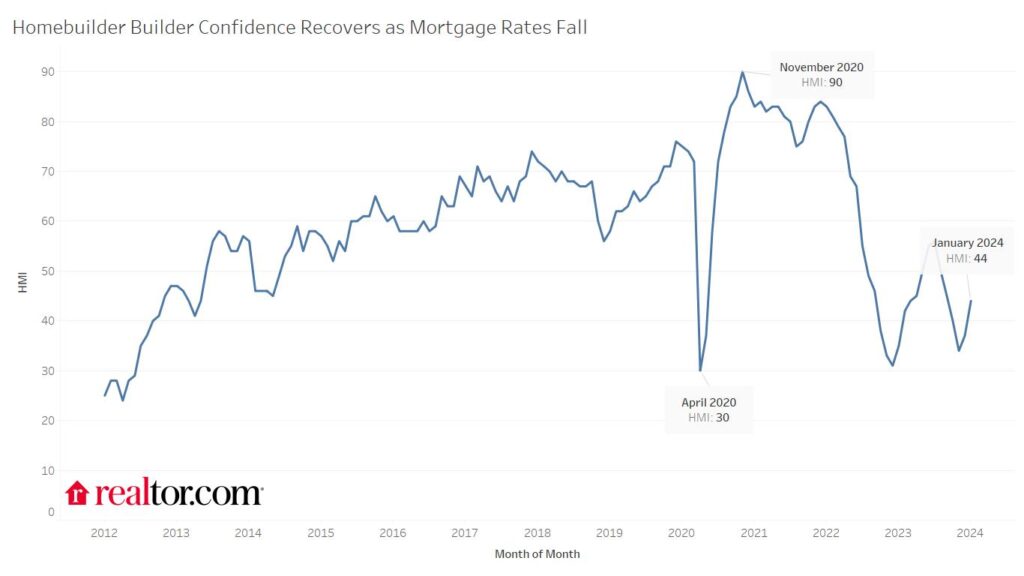
New construction activity settled slightly in 2023, but remained above pre-pandemic levels. Mortgage rates started the year in the low-to-mid 6% range and finished the year roughly one percentage point higher. Prices hovered near the previous year’s level, but did not reach a new all-time high. As a result, the housing market continued along at a relatively low level of activity as buyers struggled with affordability and sellers felt locked-in by high mortgage rates. Builder confidence climbed through the first half of the year, but remained below pre-pandemic levels. As mortgage rates started to climb towards 8% in the fall, homebuilder confidence tumbled, reaching an index of 34 in November, the third lowest level since 2012.
Though both single- and multi-family housing starts fell year-over-year in 2023, both remained above pre pandemic levels as both buyer and renter demand remained strong relative to supply. Overall housing starts fell 9.0% year-over-year while single-family starts fell 6.0% and multi-family starts fell 14.4%. Mortgage rates remained above 6%, and even reached as high as 7.79% in 2023. High mortgage rates stifled both buyer and seller demand, but low inventory levels meant that home prices hovered close to the previous year’s level for the whole year. Builders responded with a relatively steady rate of construction, but were understandably cautious, looking for buyer demand to drive more construction. Despite low new and existing home inventory, 1.665 million new households formed, outpacing the year’s 1.413 million housing starts, 947,200 of which were single-family.
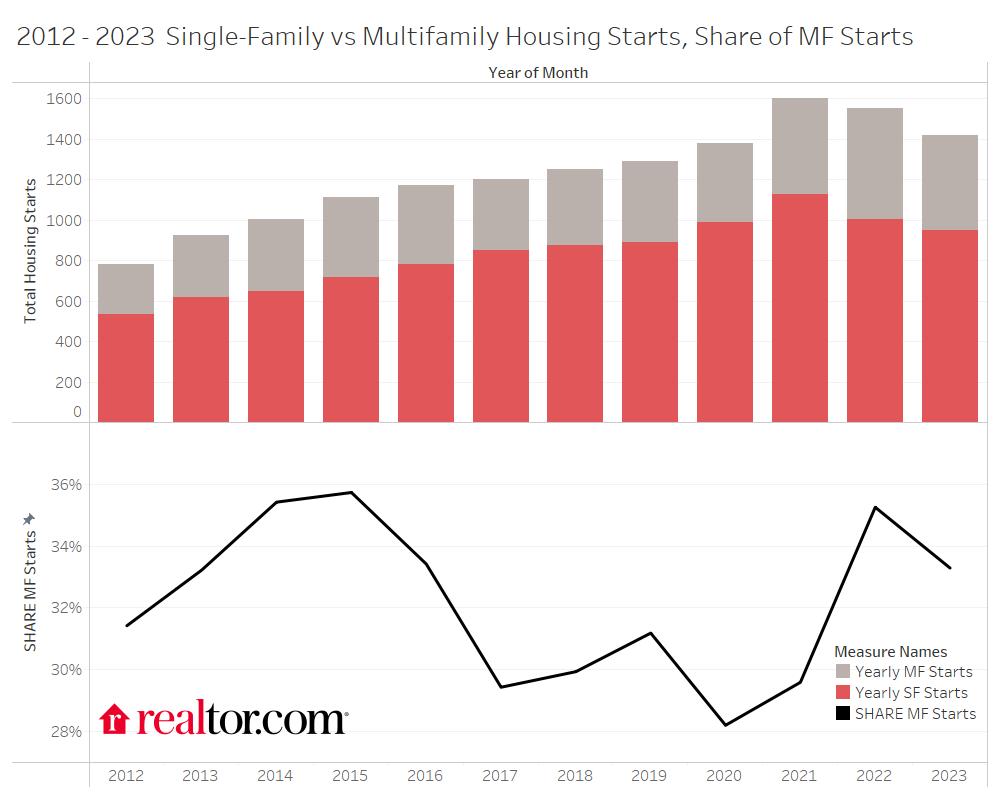
Housing construction of buildings with 2-or-more units was 29.6% of all housing starts in 2021 and grew to 35.3% by the end of 2022. In 2023, this share settled to 33.3%, higher than the period right before the pandemic, but lower than in 2013-2016. The typical multi-family home took 17 months to complete in 2022, whereas a single-family home took closer to 8 months, which means that surging multi-family starts in 2022 led to the highest level of multifamily completions in over a decade in 2023. As a result, rents fell for 8 consecutive months by the end of 2023 as rental inventory took some upward pressure off of rent levels. Multi-family housing can help with ongoing housing affordability issues by providing more supply for renters.
The Housing Supply Gap Widens, Multi-family Starts Slow
In 2023, an additional 1.7 million households formed, resulting in a total of 17.2 million new households between 2012 and 2023. Homebuilders started construction on 947,200 single-family homes and 472,700 multi-family homes in 2023, bringing the 2012 to 2023 overall housing starts total to 14.7 million homes, roughly 10 million of which were single-family. As household formations outpaced housing starts in 2023, the gap between total housing starts and household formations widened from 2.3 million housing units between 2012 and 2022 to 2.5 million units at the end of 2023. The gap between single-family housing starts and household formations grew from 6.5 million at the end of 2022 to 7.2 million at the end of 2023 as household formations remained steady and single-family home construction waned. Though the gap widened, it was the third smallest single-year gap between households and housing starts since 2016.
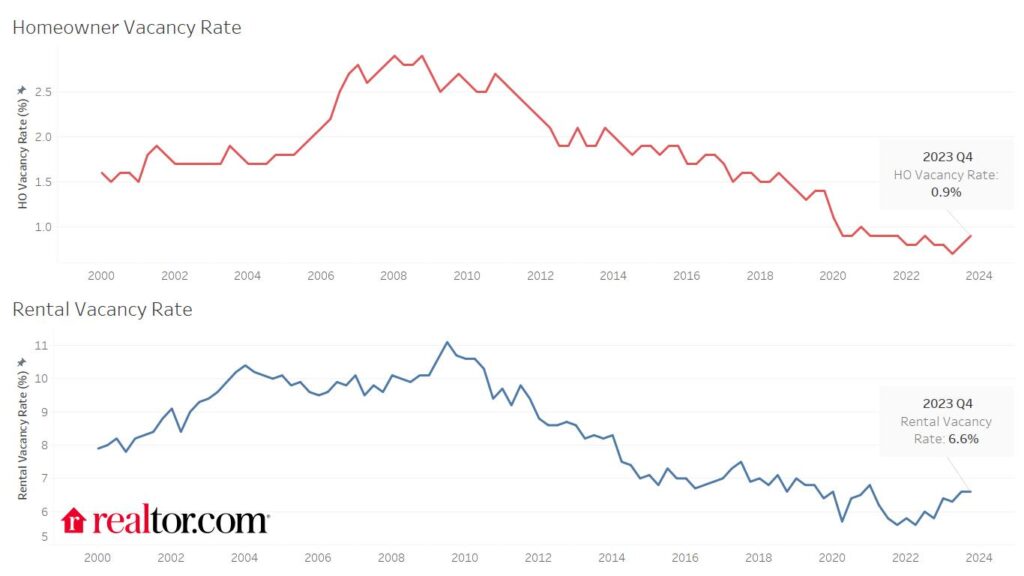
This trend of underbuilding relative to household formation carried over to homeowner vacancy rates as well as rental vacancy rates. As households form and housing starts fail to keep pace, the number of homes sitting empty falls. Homeowner vacancy dropped from 2% in 2012 to as low as 0.7% in Q2 of 2023 before recovering to 0.9% by the end of the year. Similarly, rental vacancy rates plummeted, reaching as low as 5.6% in the 2021 Q4 and again in 2022 Q2 before rising through 2023 to 6.6%. The uptick in multifamily activity in 2021 and 2022 trickled through the housing market, providing more rental inventory in 2023 which relieved some pressure on rental inventory and allowed rental vacancy to creep higher.
Between 2012 and 2023, the average rate of household formation was 1.4 million households per year, while the average rate of housing starts was 1.2 million homes (including both single-family and multi-family) per year. Housing starts climbed each year between 2012 and 2021, reaching 1.64 million in 2021 before falling slightly in 2022 to a year’s end figure of 1.55 million. Housing starts fell again in 2023, reaching just 1.42 million starts in the year. Multi-family properties comprised, on average, 32.1% of housing starts between 2012 and 2021, before growing significantly to 35.1% in 2022 as mortgage rates and prices led to a pullback in demand for single-family homes. Falling demand for single-family homes opened up the opportunity for more building in the multi-family market, which is dominated by rentals. In 2023, multi-family share fell to 33.3% as construction activity shifted back towards single family homes. However, the share of multi-family home completions reached 31.0% in 2023, the highest share since 2015. In 2023, an average 97.0% of all multi-family units started were intended to be used as rentals.
Homebuilder Sentiment Remains Low
In the 2010-2021 time period, home builder sentiment climbed. In 2010, confidence was still recovering from the housing crash, but the next decade marked a period of confidence-boosting expansion. Even the disruption of the pandemic served to ultimately boost builder confidence to new all-time highs, and to maintain it above pre-pandemic levels after the initial shock wore off. After homebuilder sentiment hit the lowest levels since 2012 in April 2020, it has been on a relatively steady upward trend, reaching an all-time high of 90 in November 2020. In 2021, homebuilder sentiment averaged 81, the highest average yearly sentiment on record, up 11 points from 2020. However, as mortgage rates climbed in early 2022, homebuilder sentiment fell as low as 31, its lowest level since the early months of the pandemic, and before that, since June 2012.
In 2023, homebuilder sentiment only reached as high as an index of 56 in July, but only fell as low as 34 in December, marking a year of widely varying sentiment on the weaker end of its recent range. Homebuilders were relatively cautious in 2023 in the face of ongoing unaffordability. Both single- and multi-family homebuilding remained low relative to the pandemic era, but were higher than pre-pandemic.
What Would it Take to Close the Gap?
In 2023, household formations settled from the 2022 surge to a level more in line with 2019-2021. With the lower level of 1.665 million household formations and relatively sustained housing starts, the gap between new households and new construction grew by less than in 2022. With roughly 85 homes started for every 100 household formations, the overall housing supply gap grew to 2.5 million homes, and the single family housing supply gap grew to 7.2 million fewer home starts than household formations since 2012. The single-family housing supply gap overstates the housing shortage, as new multi-family homes offer options to some buyers and many renters. Multifamily housing is an important option and as a result of recent construction trends is poised to offer more inventory, taking some pressure off of both home and rental prices, as seen in 2023.
If only single-family homes are considered, the rate of housing starts would need to triple to keep up with demand and close the existing 7.2 million home gap in 4 to 5 years. However, if the rate of total (multi- & single-family) housing starts increased by 50% from the 2023 rate to an average rate of 2.1 million housing starts per year, a pace of construction on par with what we saw in the early 1970s and some of the peak months for building in the mid-2000s, it would take between 2 and 3 years to close the existing 2.5 million home gap, assuming the 2012 – 2019 average rate of household formations (~1.3 million households per year). Closing the total housing gap would mean an increase in both single and multi-family supply and would help return balance to the housing market by taking pressure off of both sale and rent prices.
2023 Home Completions Outpace Previous Years
Housing completions reached the highest rate since 2007 in 2023, due to the sustained uptick in single-family homes started in 2021 and early 2022 augmented by a surge in multi-family completions. As mortgage rates and high prices caught up to buyers, homebuilders pivoted to multi-family housing starts through late 2022. The latest housing completion data suggest that 2024 multi-family completions are on track to climb once again, emphasizing the lasting effect of the mid-pandemic surge in multi-family construction activity.
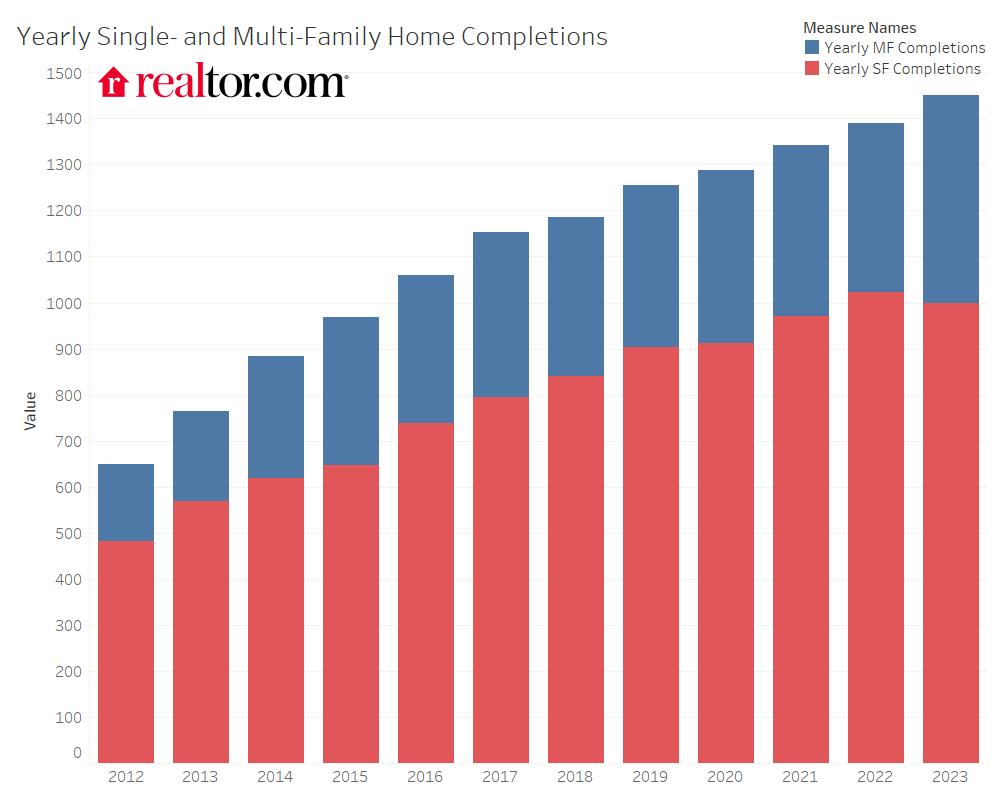
The spillover effect of the uptick in single-family housing starts in 2021 and into early 2022 drove the high number of homes completed through 2022. Single-family home completions remained near the 2022 level in 2023, falling just 2.2% from 1,022,000 completed single family homes in 2022 to 999,700 in 2023. The number of housing starts per completion remained above 1 from 2012 through 2022, but due to the uptick in completions and slowdown in starts, it fell to 0.98 in 2023. The pickup in home completions and the slowdown in starts suggests that builders continue to manage their pipeline, and amid the still increasing housing supply gap, many buyers may continue to struggle to find suitable home options.
Affordable New For-Sale Inventory Starts to Recover
In 2022, just 38% of new homes were sold for less than $400,000. However, in 2023, this share increased to 43%, indicating a shift toward more affordability in the new construction space. Many builders offered price cuts and other incentives in 2023 to prompt home sales and also focused on smaller units, which likely led to this progress in affordability. The median single family home started shrank from a median size of 2,269 square feet to 2,179 square feet in 2023.
Housing Stock Losses Claim 0.9% of Housing per Year
Based on the 2017 – 2019 Components of Inventory Change report (latest available), roughly 0.9% of the existing 2017 housing stock was lost by 2019. A housing stock ‘loss’ could be either permanent (such as demolition) or temporary (could feasibly return to the stock). In the time period studied, housing stock losses were almost entirely temporary (as opposed to permanent) losses. Housing stock losses introduce an additional supply gap to be filled by new construction unrelated to new households. This means that along with the gap discussed throughout this study, there exists a gap between existing households and obsolete housing stock, which would add to the overall housing supply gap. Likewise, there are housing stock additions in the form of recovered temporary losses. For the purposes of this study, we have not factored in these stock losses and additions, but acknowledge that these shifts affect overall housing stock and have implications for the estimated supply gap.
Sunbelt Metros Grow Faster than Home Permitting Activity
At the metro-level, some areas have seen outsized household growth relative to permitting activity, suggesting that housing supply may be lagging demand. We looked at the change in households between 2012 and 2023 as well as the number of total as well as single-family residential permits in the same timeframe to gauge how permitting is measuring up to population growth in the top 100 US metros.
Looking at just the gap between single-family permits and household formations reveals that permitting activity has lagged household growth in 73 of the top 100 metros in the US. The metros with the largest single-family gap include San Antonio-New Braunfels, TX, Austin-Round Rock, TX, and Deltona-Daytona Beach-Ormond Beach, FL. The top 10 list by size of gap relative to population includes 3 Texas metros, 5 Florida metros, and 2 Washington metros. Many of these areas have seen significant population growth due to the affordable cost of living and overall desirability. Though the potential single-family home supply gap is large in these areas, many of these dense areas have leaned into multi-family housing whether for rent or for purchase. Including multi-family permits, many of which are used for rentals, just 13 of the top 100 metros have seen faster household growth than permitting activity over the last 11 years.
Including both single- and multi-family permits shows that sunny markets such as Deltona-Daytona Beach-Ormond Beach, FL, San Antonio-New Braunfels, TX, Palm Bay-Melbourne-Titusville, FL and Miami-Fort Lauderdale-Pompano Beach, FL have seen household growth significantly outpace home permitting activity since 2012. These (mostly) affordable markets offer buyers bang for their buck, and home shoppers have flocked in response. The 10 areas where household growth has outpaced permitting activity the most are home to 5.7% of total US households, and accounted for 5.6% of permits in 2023, so these areas are seeing an justified share of homebuilding. However, these areas have grown an average 13.6% over the last 12 years, and our estimates suggest that more building is needed.
| Geography: | 2012-2023 HH Growth vs Total Permit Gap Scaled by Household Count | Median Listing Price Change (Jan 2024 vs Jan 2019) | Jan 2024 Listings vs 2019 |
| USA | 0.5% | 41.5% | -40.1% |
| Deltona-Daytona Beach-Ormond Beach, FL | 5.1% | 48.4% | -12.6% |
| San Antonio-New Braunfels, TX | 3.3% | 17.7% | 15.2% |
| Palm Bay-Melbourne-Titusville, FL | 2.6% | 38.8% | -14.8% |
| Allentown-Bethlehem-Easton, PA-NJ | 2.4% | 72.0% | -69.3% |
| Grand Rapids-Kentwood, MI | 1.6% | 46.8% | -56.8% |
| Stockton, CA | 1.4% | 41.0% | -50.6% |
| Riverside-San Bernardino-Ontario, CA | 1.1% | 46.6% | -48.6% |
| Providence-Warwick, RI-MA | 0.9% | 44.3% | -70.2% |
| Bakersfield, CA | 0.7% | 56.0% | -42.1% |
| Miami-Fort Lauderdale-Pompano Beach, FL | 0.6% | 44.7% | -36.4% |
Moving Forward
We expect existing home supply to remain lacking in 2024 as mortgage rates ease, but not so much as to encourage homeowners to sell. As a result, builder activity will continue to be an important lever to offer buyers options and to relieve some price pressure.
In the for-sale housing market, low home inventory is keeping time on market quick and prices elevated. Homeowners remain hesitant to sell due to high mortgage rates, but this more favorable selling environment brought more sellers into the market towards the end of 2023, offering a few more options to homebuyers. The housing supply shortage will continue to put pressure on the housing market as buyers return to the market this spring in search of an affordable home but an uptick in existing home sellers and sustained new construction activity could mean some progress toward more balance this year.
Renters are likely to see further relief in 2024 as multi-family completions come online, increasing rental supply and easing rent prices. Renting is likely to remain a more affordable alternative to buying in many US metros until mortgage rates ease further. With the ongoing housing supply gap, new construction creates vitally needed options for new households.
Data:
- Household Formations (https://fred.stlouisfed.org/series/TTLHHM156N)
- Housing starts (https://www.census.gov/construction/nrc/index.html)
- Quarterly new home sale prices (https://www.census.gov/construction/nrs/pdf/quarterly_sales.pdf)
- Home builder sentiment (HMI) (https://www.nahb.org/news-and-economics/housing-economics/indices/housing-market-index)
- Homeowner vacancy rate (https://www.census.gov/housing/hvs/index.html)
- Housing Starts vs Completions (https://fred.stlouisfed.org/graph/?g=LCNQ)
- Home completion time (https://www.census.gov/construction/nrc/pdf/avg_starttocomp.pdf)
- Components of Inventory Change (https://www.huduser.gov/portal/datasets/cinch.html)
- Metro-level households
- Metro-level residential permits
Methodology:
To arrive at yearly household formation, the increase in households between December in the previous year and the current year were calculated. This value was used as the number of household formations in the current year. Home starts, completions and permits refer to the total single-family homes metric in the Census construction data. HMI and vacancy data were pulled and displayed as stated in the data source.
To understand how long it would take to close the gap between household formations and housing starts, the assumption was made that each projected year would see the yearly average number of household formations as assessed from 2012-2019. The assumed base rate of home building was the 2023 average. Any reference to double or tripling the rate of homebuilding is referring to the 2023 average rate of home building.

