South Florida Inventory Search

South Florida Inventory Search
Click to Search the Complete South Florida Property Inventory

Wednesday, June 28, 2023

Florida is Home to 50% of the "Want-to-Move-to" Metros

 By Kerry Smith

More buyers want to relocate – but fewer do thanks to a tight inventory of available homes. Phoenix is No. 1 but Florida cities hold all spots from No. 3 to No. 7.

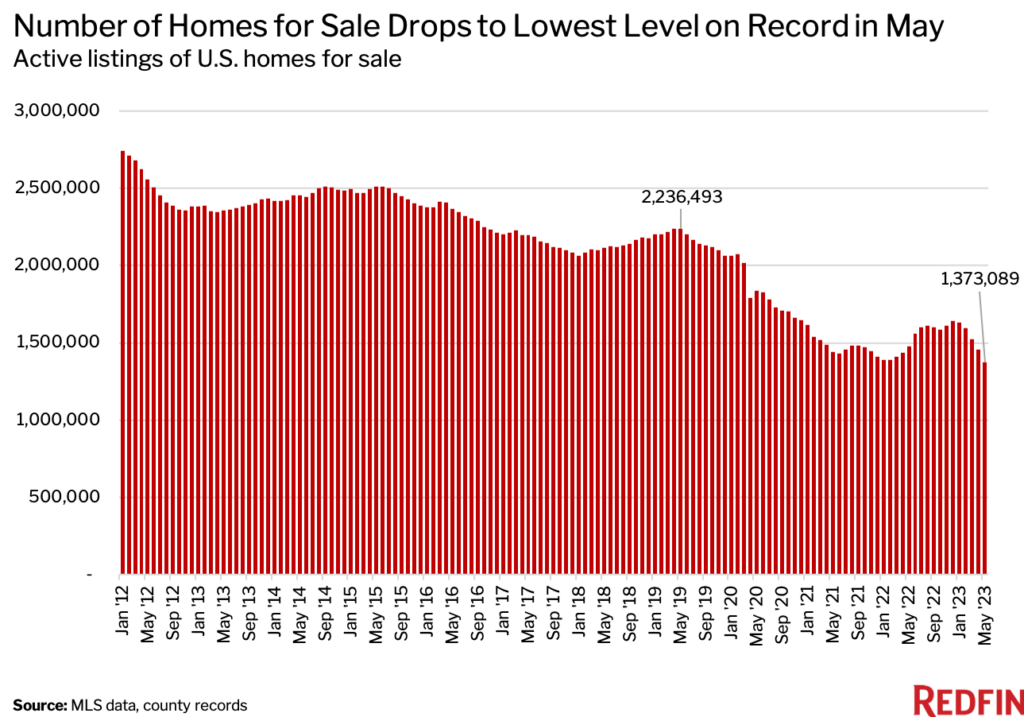
SEATTLE – One in four U.S. homebuyers (25.4%) want to move to a different metro area, largely to escape high home prices where they live now. A year ago it was 23%; before the pandemic it was less than 20%. And, overall, five Florida metro areas rank in the top 10 go-to cities in the U.S.

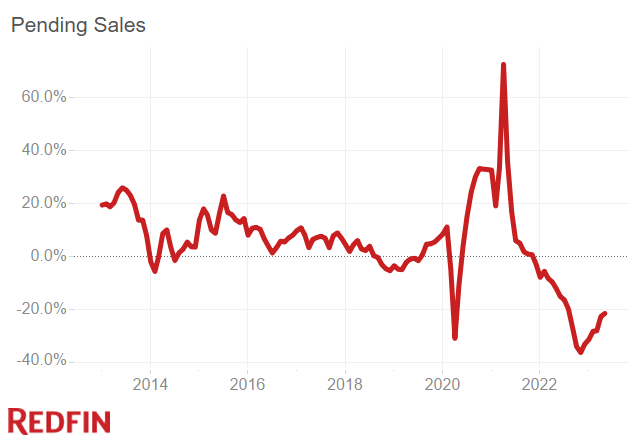
However, rising mortgage rates have moved some buyers out of the market, and while the percentage looking to move farther from home increased, the total number of buyers looking to move has decreased – down 7% from a year ago and the biggest decline on record, according to a report from Redfin.

Still, out-of-town moves have held up better than in-town moves. The number of homebuyers looking to move within their current hometown is down a record 18%. In other words, the overall homebuying pie has shrunk, but buyers moving to a new metro make up the biggest piece of that pie on record.

Top 10 U.S. move-to-metros in May 2023

  1. Phoenix: Net inflow at 8,100. Top move-from destination is Seattle
  2. Las Vegas: Net inflow at 6,900. Top move-from destination is Los Angeles
  3. Miami: Net inflow at 6,900. Top move-from destination is New York City
  4. Tampa: Net inflow at 9,000. Top move-from destination is New York City
  5. Orlando: Net inflow at 1,400. Top move-from destination is New York City
  6. North Port-Sarasota: Net inflow at 4,900. Top move-from destination is Chicago
  7. Cape Coral: Net inflow at 4,600. Top move-from destination is Chicago
  8. Dallas: Net inflow at 4.500. Top move-from destination is Los Angeles
  9. Sacramento, Calif.: Net inflow at 4,300. Top move-from destination is Chicago
  10. Houston: Net inflow at 63,700. Top move-from destination is New York City

Net inflow is a measure of how many more Redfin.com users looked to move into an area rather than leave.

“Climate risks haven’t yet stopped many homebuyers from moving into areas that don’t have enough water, like Phoenix, and places that could eventually be underwater, like coastal Florida,” says Redfin Chief Economist Daryl Fairweather. “That’s because even though Sun Belt home prices soared during the pandemic, those metros remain a bargain for people relocating from expensive coastal cities.”

© 2023 Florida Realtors®

Tuesday, June 27, 2023

Analysis: U.S. Needs More than 4 Million Homes

  By Adam Barnes

Buyer demand remains high, in part, because so many young adults lived with their parents during the pandemic. And due to rising prices, low-income families suffer the most.

WASHINGTON – Americans seeking to move out on their own outnumbered available housing by almost two to one in 2021, according to a new report. There were roughly 8 million individuals or families who lived in another person’s home in 2021 and just 3.7 million homes for rent or sale, Zillow revealed Friday, leaving a deficit of 4.3 million homes.

“The U.S. housing market is like a high-stakes version of the game musical chairs,” Orphe Divounguy, senior economist at Zillow, said in a news release. “There are simply not enough homes for millions of people. Unless we address the shortage of smaller, more-affordable, starter-type homes, we risk leaving families without a seat – and it will only get worse over time,” he added.

Zillow’s analysis notes that the crisis is hitting low-income families the hardest with 68% in this category sharing spaces. And the housing gap was greatest in some of the most expensive coastal cities.

Pandemic price surge put housing out of reach

Housing affordability took a major hit during the pandemic as short supply met increasing demand. During the pandemic, both rents and sale prices soared. In the last year, the typical rent rate rose by close to 5% – up to $2,048 per month – while the value of a typical home jumped to nearly $347,000, Zillow data showed.

On the purchase side, high mortgage rates driven by the Federal Reserve’s ongoing effort to cool inflation have only worsened affordability for would-be buyers.

Currently, the 30-year fixed rate mortgage is 6.67%, according to Freddie Mac data.

“Potential homebuyers have been watching rates closely and are waiting to come off the sidelines. However, inventory challenges persist as the number of existing homes for sale remains very low,” Freddie Mac Chief Economist Sam Khater said in a statement.

“Though, a recent rebound in single-family housing starts is an encouraging development that will hopefully extend through the summer,” he added.

Construction rebound could help repair market

New construction surged by 21.7% on an unadjusted basis in May, beating economists’ expectations of a small decline.

Housing starts jumped to an annual rate of 1.63 million units last month, up from 1.34 million in April, according to Census Bureau data released Tuesday. Single-family and multifamily construction experienced monthly increases.

Single-family starts jumped by 18.5% over revised April figures to a rate of 997,000 units while starts for buildings with five or more units was 624,000.

© 2023 WCBD, Nexstar Broadcasting, Inc. All rights reserved.

Friday, June 23, 2023

Redfin: There Were Fewer Homes for Sale in May Than Any Other Month on Record

 by 

  • The pool of homes for sale is shrinking because homeowners feel trapped by rising mortgage rates, with new listings down 25% to the third lowest level on record.

  • A shortage of homes for sale is fueling bidding wars in some areas despite sluggish homebuyer demand; 37% of homes that sold in May went for more than their list price, a higher share than usual for this time of year.

  • Homebuyer competition is propping up prices, which were down just 3% in May from the record high hit a year earlier.

The number of homes for sale in the U.S. fell 7.1% year over year to 1.4 million on a seasonally adjusted basis in May. That’s the lowest level in Redfin’s records, which date back to 2012, and the first annual decline since April 2022.

By comparison, there were 2.2 million homes for sale in May 2019—before the pandemic rocked the U.S. housing market—meaning housing supply was 38.6% below pre-pandemic levels this May.

America’s housing stock is dwindling because there are very few people selling homes. New listings of homes for sale declined 25.2% year over year in May to the third lowest level on record on a seasonally adjusted basis, as homeowners were handcuffed by high mortgage rates. 

Shortage Is Fueling Homebuyer Competition in Many Markets

While demand from homebuyers has fallen, new listings have fallen even further, meaning many of the buyers who are out there are encountering bidding wars.

Even though the typical home that sold in May was purchased for its list price, more than one-third (37.5%) went for more than their list prices—a sign that some buyers are facing competition. That’s down from 59% a year earlier but is the highest share of any May on record prior to the pandemic.

Speed is another good way to gauge competition; the typical home that sold in May went under contract in 31 days. That’s nearly twice as long as a year earlier (17 days) but is the shortest timespan of any Many on record prior to the pandemic.

Nearly half (46.7%) of home offers written by Redfin agents faced a bidding war in May on a seasonally adjusted basis. While that’s down from 56.1% a year earlier and a peak of 69.6% in January 2022, it’s notable that so many buyers are facing competition at a time when demand is sluggish. An offer is considered part of a bidding war if a Redfin agent reported that it faced at least one competing bid.

“There’s a huge lack of housing inventory in Miami, and that combined with higher interest rates is making homebuyers’ lives very challenging. Their money just isn’t going as far,” said local Redfin Premier real estate agent Rafael Corrales. “I’m encouraging my buyers to be a little more flexible; in some cases, I’m suggesting they go back to 2021 winning strategies, which can mean waiving contingencies and offering high earnest money deposits because they’re competing against a lot of cash buyers.”

One-third (33.4%) of U.S. home purchases were made in cash in April, the latest month for which data is available. That’s up from 30.7% a year earlier and comparable with February’s 33.5% share, which was the highest in nine years. Cash purchases are becoming more common because elevated mortgage rates are deterring many house hunters who would need to take out mortgages, leaving cash buyers to take up a larger piece of the homebuying pie. 

Home Sales Are Falling, But Not as Quickly as They Were at the Start of the Year

Closed home sales fell 19.8% year over year on a seasonally adjusted basis in May, the smallest drop in nearly a year and an improvement from the record 35.3% decline in January. Still, sales were significantly below pre-pandemic levels, down 21% from May 2019. 

Pending home sales performed similarly. They fell 21.4% year over year on a seasonally adjusted basis in May, the smallest drop since last summer and an improvement from the record 36.1% decline in November. Pending sales were down 16.1% from May 2019 levels.

Metro-Level Highlights: May 2023

Data in the bullets below came from a list of the 91 U.S. metro areas with populations of at least 750,000. Select metros may be excluded from time to time to ensure data accuracy. A full metro-level data table can be found in the “download” tab of the dashboard embedded below or in the monthly section of the Redfin Data Center. Refer to our metrics definition page for explanations of metrics used in this report. Metro-level data is not seasonally adjusted.

  • Pending sales: In Boise, pending sales fell 70.1% year over year, more than any other metro Redfin analyzed. It was followed by Baton Rouge, LA (-66%) and Allentown, PA (-54%). The smallest declines were in Dallas (-0.3%), Fort Worth (-2.2%) and Buffalo, NY (-3.5%).
  • Closed sales: In Tacoma, WA, closed home sales dropped 38.9% year over year, more than any other metro Redfin analyzed. Next came Seattle (-34.7%) and Portland, OR (-32.9%). The smallest declines were in Atlanta (-1.5%), North Port, FL (-2.1%) and Fort Worth (-4.4%).
  • Prices: Median sale prices fell from a year earlier in 40 of the metros Redfin analyzed. The biggest declines were in Austin (-15.1%), Boise (-14.3%) and Oakland (-11.2%). The biggest increases were in Hartford (10%), Rochester (9.7%) and Cincinnati (9.3%).
  • Listings: New listings fell most from a year earlier in Allentown (-55.7%), Greensboro, NC (-51.1%) and Boise (-48.8%). They fell least in McAllen, TX (-7.3%), Buffalo (-8.9%) and El Paso, TX (-9.4%).
  • Supply: Active listings fell most from a year earlier in Allentown (-46%), Greensboro (-38.6%) and Cincinnati (-37.6%). They rose most in North Port (50.8%), New Orleans (45.9%) and McAllen (40.4%).
  • Competition: In Rochester, 72.7% of homes sold above their final list price, down from 75.8% a year earlier. That 3.1-percentage-point decline is the smallest among the metros Redfin analyzed. Next came Milwaukee (-3.4 ppts) and Hartford (-4.3 ppts). The largest declines were in Austin (-48 ppts), Dallas (-40.4 ppts) and North Port (-36.9 ppts).

Below is a market-by-market breakdown of home-purchase cancellations, which aren’t in the Redfin Data Center.

Home-Purchase Cancellations

Data below came from a list of the 50 most populous metro areas. 

Metro AreaMay 2023: Pending Sales That Fell Out of Contract, as % of Overall Pending SalesApril 2023: Pending Sales That Fell Out of Contract, as % of Overall Pending SalesMay 2022: Pending Sales That Fell Out of Contract, as % of Overall Pending Sales
Anaheim, CA13.1%12.5%14.7%
Atlanta, GA20.6%18.4%17.2%
Austin, TX13.2%11.2%13.5%
Baltimore, MD9.5%10.5%10.9%
Boston, MA7.2%7.7%6.9%
Charlotte, NC10.4%10.4%8.1%
Chicago, IL14.4%13.3%13.8%
Cincinnati, OH11.4%9.8%10.9%
Cleveland, OH15.3%14.6%14.2%
Columbus, OH13.1%11.2%10.8%
Dallas, TX17.3%15.5%16.8%
Denver, CO14.7%13.3%6.6%
Detroit, MI16.1%14.0%14.8%
Fort Lauderdale, FL20.8%19.3%20.9%
Fort Worth, TX18.3%16.2%15.8%
Houston, TX18.6%16.9%18.5%
Indianapolis, IN15.4%14.7%12.1%
Jacksonville, FL21.8%19.5%21.7%
Kansas City, MO12.9%10.6%10.1%
Las Vegas, NV21.5%18.4%21.4%
Los Angeles, CA14.6%14.1%15.2%
Miami, FL19.6%16.7%19.3%
Milwaukee, WI8.0%6.5%8.1%
Minneapolis, MN7.7%7.9%6.5%
Montgomery County, PA6.1%5.6%5.4%
Nashville, TN14.6%12.1%11.2%
Nassau County, NY4.1%3.8%4.3%
New Brunswick, NJ10.9%11.9%10.0%
New York, NY8.4%8.0%5.6%
Newark, NJ8.9%10.0%1.8%
Oakland, CA6.8%8.3%7.4%
Orlando, FL21.1%19.4%20.6%
Philadelphia, PA12.4%11.4%11.9%
Phoenix, AZ18.0%15.4%19.3%
Pittsburgh, PA15.3%12.1%12.2%
Portland, OR11.5%11.7%10.7%
Providence, RI8.8%9.3%8.7%
Riverside, CA17.5%16.5%18.0%
Sacramento, CA13.4%14.7%13.0%
San Antonio, TX20.4%18.8%17.9%
San Diego, CA13.7%13.0%14.5%
San Francisco, CA4.8%4.0%4.7%
San Jose, CA6.2%6.6%6.7%
Seattle, WA7.3%8.6%5.5%
St. Louis, MO11.7%11.1%10.7%
Tampa, FL21.7%18.9%20.1%
Virginia Beach, VA12.3%13.0%12.3%
Warren, MI11.9%11.1%9.6%
Washington, D.C.9.6%9.2%9.3%
West Palm Beach, FL17.3%17.4%20.2%
National—U.S.A.14.4%13.4%12.2%


Avatar

Lily Katz

As a data journalist, Lily is passionate about helping readers understand complex facets of the housing market. She is particularly interested in the issues of climate change, race and gender equality and housing affordability. Prior to working at Redfin, Lily spent four years as a reporter at Bloomberg News in New York City.

 Email Lily