
Janice McDill, October 31, 2022 - Knock

Highlights
- 98 markets saw declines from their May 2022 highs; prices in 42 major housing markets are projected to fall further from their record highs by September 2023
- Providence, Rhode Island, and Salisbury, Maryland, were the only markets where home prices have remained at their peaks set this summer
- National median home price will fall to $390,766 in January before reaching a new high of $416,500 in July 2023
- Twenty-seven of the nation’s 100 largest markets will favor buyers by September 2023, up from 16 this year
Prices in all markets remain at or below summer 2022 peaks, more will fall further
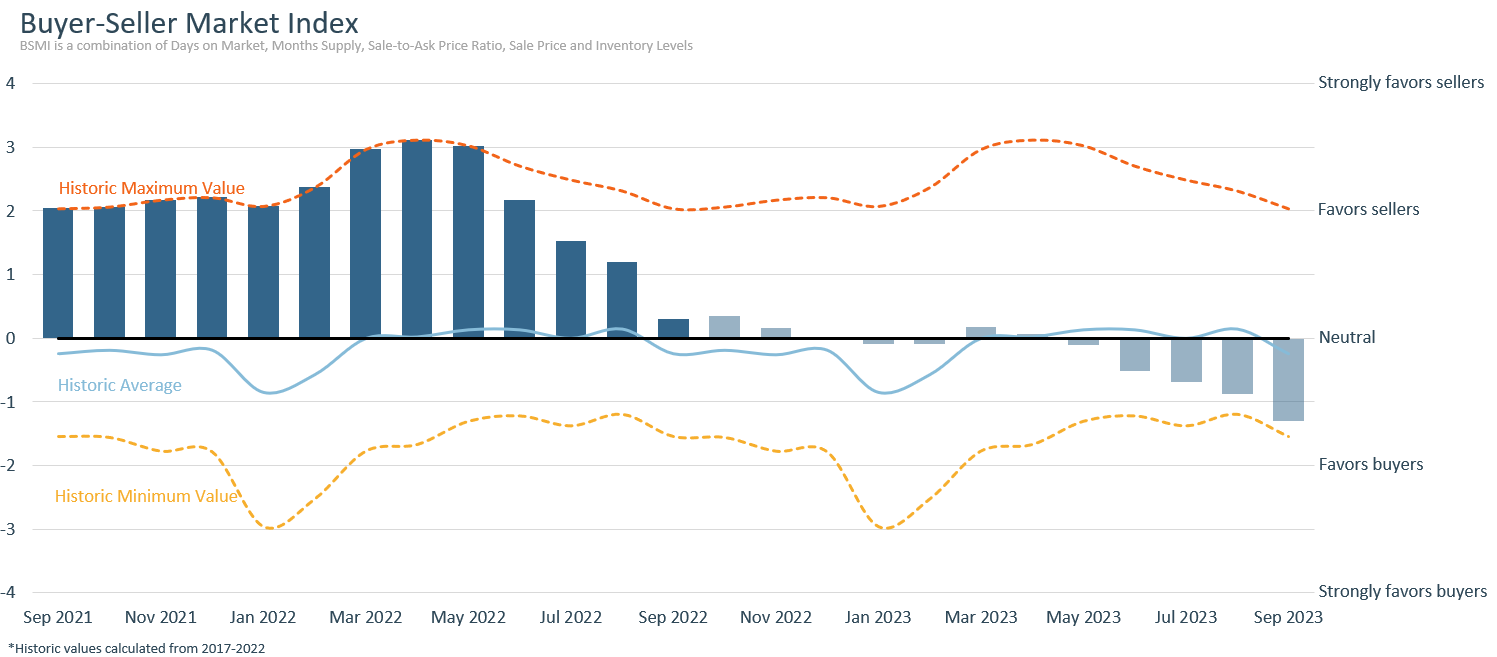
As mortgage rates remain at 20-year highs following the Federal Reserve's aggressive rate hikes to curb inflation, the national housing market continued to cool off in September, according to the Knock Buyer-Seller Market Index, which analyzes key housing market metrics to measure the degree to which the nation’s 100 largest markets favor home buyers or sellers. The Index showed that across the nation’s 100 largest housing markets, the supply of homes for sale has steadily grown and the typical sale price has dropped over the course of this year. During the first nine months of 2022, just over 1.8 million homes had sold across the nation's largest housing markets -- less than total sales by this month in each of the past four years.
Although the median home sale price in the largest 100 U.S. housing markets continued to grow year-over-year in September, rising 6.6% to $388,000, the national median home price was down 5.4% from its $410,000 peak in May. September’s year-over-year growth reflects more typical appreciation, but it is well below the double-digit price growth of the past two years.
In September, 98 markets saw home prices below their peak price in May. Providence, Rhode Island, and Salisbury, Maryland, were the only markets where home prices have remained at their peaks set this summer.
Fifteen markets saw prices drop by 10% or more in September from their price peaks - in all cases set between April and June this year.

Prices in most of these 15 markets are expected to start rising this fall, but only marginally, before dipping down again. The projected median sale price for September 2023 will remain below the 2022 summer peaks in all 15 of these markets.
Like many markets reporting price declines compared to this summer, cities in the West and South dominate the largest declines. Seven of the 15 markets that saw price drops of 10% or more since this past summer are in the West, another seven are in the South, and just one (Bridgeport, Connecticut) is in the Northeast.
For markets with large declines off their summer peaks, unusually strong YoY price growth is forecast in three cities: Winston-Salem, North Carolina (10.3%), Fayetteville, Arkansas (9.1%), and Seattle, Washington (8.9%).
15 markets with largest price drops from peak
| Rank | Market | Peak price | Month of peak price | Current median price | % change from peak | Forecasted median sale price | YoY price change (2022-23) |
| National | $410,000 | May 2022 | $388,000 | -5.4% | $414,000 | 6.6% | |
| 1 | Reno, Nev. | $570,000 | May 2022 | $490,000 | -14.0% | $491,000 | 0.2% |
| 2 | Winston-Salem, N.C. | $282,000 | June 2022 | $245,000 | -13.1% | $270,000 | 10.3% |
| 3 | Boise City, Idaho | $535,000 | May 2022 | $465,000 | -13.1% | $448,000 | -3.6% |
| 4 | Austin-Round Rock-Georgetown, Texas | $590,000 | May 2022 | $515,000 | -12.7% | $535,000 | 3.8% |
| 5 | New Orleans-Metairie, La. | $315,000 | June 2022 | $275,000 | -12.7% | $286,000 | 3.9% |
| 6 | San Jose-Sunnyvale- Santa Clara, Calif. | $1,600,000 | April 2022 | $1,400,000 | -12.5% | $1,443,000 | 3.1% |
| 7 | San Francisco-Oakland-Berkeley, Calif. | $1,300,000 | April 2022 | $1,145,000 | -11.9% | $1,148,000 | 0.3% |
| 8 | Fayetteville-Springdale-Rogers, Ark. | $345,000 | June 2022 | $306,000 | -11.3% | $334,000 | 9.1% |
| 9 | Savannah, Ga. | $333,600 | June 2022 | $296,000 | -11.3% | $308,000 | 3.9% |
| 10 | Pensacola-Ferry Pass-Brent, Fla. | $338,000 | June 2022 | $300,000 | -11.2% | $319,000 | 6.2% |
| 11 | Las Vegas-Henderson-Paradise, Nev. | $450,000 | May 2022 | $400,000 | -11.1% | $386,000 | -3.5% |
| 12 | Ogden-Clearfield, Utah | $499,900 | June 2022 | $445,000 | -11.0% | $458,000 | 3.0% |
| 13 | Naples-Marco Island, Fla. | $625,000 | May 2022 | $560,000 | -10.4% | $584,000 | 4.3% |
| 14 | Bridgeport-Stamford-Norwalk, Conn. | $639,000 | June 2022 | $574,000 | -10.2% | $595,000 | 3.6% |
| 15 | Seattle-Tacoma-Bellevue, Wash. | $750,000 | April 2022 | $675,000 | -10.0% | $735,000 | 8.9% |
Home prices in 42 major housing markets are projected to fall further from their 2022 record highs by next September. The top 10 markets with forecasted price drops through September 2023 are: Boise City, Idaho (-16.2%); Lakeland, Florida (-14.2%); Las Vegas, Nevada (-14.2%); Reno, Nevada (-13.9%); San Francisco, California (-11.7%); San Jose, California (-9.8%); Austin, Texas (-9.3%); Oxnard, California (-9.3%); New Orleans, Louisiana (-9.3%) and Ogden, Utah (-8.3%).
Fifteen of the 42 markets are in the South, including three of the 10 markets with the largest forecasted price drops: Lakeland, Florida, Austin, Texas and New Orleans, Louisiana. Another 15 are in the West -- home to some of the most expensive markets in the nation. The remaining seven and five markets forecasting prices below this summer's peak are in the Midwest and Northeast, respectively. Bridgeport, Connecticut, is forecasted to see the largest price drop -7.8%, while Springfield, Missouri, will lead the Midwest with a projected price decline of 3.9%.
These markets tend to be where prices reached their highest levels this past summer. In 15 of the 25 markets with the largest projected median sale price declines, prices peaked at well above the national high of $410,000. The median sale price peaked at $1.3 million and $1.6 million in San Francisco and San Jose, California, in April 2022, respectively.
42 markets with forecasted price declines
| Rank | Market | Forecasted price decline from 2022 peak | Peak price | Peak month | Sept. 2023 forecasted median sale price | Sept. 2022 median sale price | 2019 median sale price |
| National | 0.9% | $410,000 | May 2022 | $414,000 | $388,000 | $278,000 | |
| 1 | Boise City, Idaho | -16.2% | $535,000 | May 2022 | $448,000 | $465,000 | $308,490 |
| 2 | Lakeland-Winter Haven, Fla. | -14.2% | $325,000 | May 2022 | $279,000 | $302,500 | $205,000 |
| 3 | Las Vegas-Henderson-Paradise, Nev. | -14.2% | $450,000 | May 2022 | $386,000 | $400,000 | $290,000 |
| 4 | Reno, Nev. | -13.9% | $570,000 | May 2022 | $491,000 | $490,000 | $370,000 |
| 5 | San Francisco-Oakland-Berkeley, Calif. | -11.7% | $1,300,000 | April 2022 | $1,148,000 | $1,145,00 | $854,000 |
| 6 | San Jose-Sunnyvale-Santa Clara, Calif. | -9.8% | $1,600,000 | April 2022 | $1,443,000 | $1,400,000 | $1,055,000 |
| 7 | Austin-Round Rock-Georgetown, Texas | -9.4% | $590,000 | May 2022 | $535,000 | $515,000 | $320,000 |
| 8 | Oxnard-Thousand Oaks-Ventura, Calif. | -9.3% | $853,000 | April 2022 | $773,000 | $770,000 | $600,000 |
| 9 | New Orleans-Metairie, La. | -9.3% | $315,000 | June 2022 | $286,000 | $275,000 | $220,000 |
| 10 | Ogden-Clearfield, Utah | -8.3% | $499,900 | June 2022 | $458,000 | $445,000 | $286,500 |
| 11 | Savannah, Ga. | -7.8% | $333,600 | June 2022 | $308,000 | $296,000 | $215,000 |
| 12 | Bridgeport-Stamford-Norwalk, Conn. | -6.9% | $639,000 | June 2022 | $595,000 | $574,000 | $375,000 |
| 13 | Worcester, Mass.-Conn. | -6.7% | $428,000 | July 2022 | $399,000 | $390,000 | $276,000 |
| 14 | Naples-Marco Island, Fla. | -6.6% | $625,000 | May 2022 | $584,000 | $560,000 | $330,000 |
| 15 | Olympia-Lacey-Tumwater, Wash. | -5.9% | $512,500 | June 2022 | $482,000 | $465,000 | $342,950 |
| 16 | Colorado Springs, Colo. | -5.8% | $480,000 | May 2022 | $452,000 | $435,000 | $318,500 |
| 17 | Baton Rouge, La. | -5.8% | $255,000 | April 2022 | $240,000 | $240,000 | $208,900 |
| 18 | Pensacola-Ferry Pass-Brent, Fla. | -5.7% | $338,000 | June 2022 | $319,000 | $300,000 | $218,000 |
| 19 | Los Angeles-Long Beach-Anaheim, Calif. | -5.2% | $950,000 | April 2022 | $900,000 | $875,000 | $665,000 |
| 20 | Winston-Salem, N.C. | -4.2% | $282,000 | June 2022 | $270,000 | $245,000 | $175,000 |
| 21 | Phoenix-Mesa-Chandler, Ariz. | -4.1% | $480,000 | May 2022 | $460,000 | $449,000 | $280,000 |
| 22 | Springfield, Mo. | -3.9% | $250,000 | July 2022 | $240,000 | $230,000 | $162,000 |
| 23 | Buffalo-Cheektowaga, N.Y. | -3.7% | $246,000 | July 2022 | $237,000 | $230,000 | $165,500 |
| 24 | Omaha-Council Bluffs, Neb.-Iowa | -3.6% | $305,000 | June 2022 | $294,000 | $277,500 | $207,107 |
| 25 | Chicago-Naperville-Elgin, Ill.-Ind.-Wis. | -3.4% | $335,000 | June 2022 | $324,000 | $305,000 | $238,000 |
| 26 | Fayetteville-Springdale-Rogers, Ark. | -3.3% | $345,000 | June 2022 | $334,000 | $306,000 | $203,107 |
| 27 | Toledo, Ohio | -3.2% | $182,000 | July 2022 | $176,000 | $172,500 | $150,000 |
| 28 | Cleveland-Elyria, Ohio | -2.9% | $221,250 | June 2022 | $215,000 | $201,000 | $161,000 |
| 29 | Riverside-San Bernardino-Ontario, Calif. | -2.1% | $560,000 | May 2022 | $548,000 | $530,000 | $370,000 |
| 30 | Seattle-Tacoma-Bellevue, Wash. | -2.0 | $750,000 | April 2022 | $735,000 | $675,000 | $470,000 |
| 31 | Boston-Cambridge-Newton, Mass.-N.H. | -1.8% | $705,000 | June 2022 | $692,000 | $660,000 | $480,000 |
| 32 | Crestview-Fort Walton Beach-Destin, Fla. | -1.6% | $475,000 | April 2022 | $467,000 | $468,000 | $299,900 |
| 33 | Dallas-Fort Worth-Arlington, Texas | -1.4% | $425,000 | May 2022 | $419,000 | $390,000 | $267,000 |
| 34 | Oklahoma City, Okla. | -1.2% | $254,000 | June 2022 | $251,000 | $237,500 | $186,400 |
| 35 | Cincinnati, Ohio-Ky.-Ind. | -0.9% | $275,000 | June 2022 | $273,000 | $250,000 | $187,210 |
| 36 | Louisville/Jefferson County, Ky.-Ind. | -0.8% | $257,000 | June 2022 | $255,000 | $240,000 | $189,900 |
| 37 | Tulsa, Okla. | 0.7% | $256,250 | June 2022 | $254,000 | $240,500 | $176,000 |
| 38 | Richmond, Va. | 0.7% | $360,000 | June 2022 | $358,000 | $337,000 | $259,000 |
| 39 | Denver-Aurora-Lakewood, Colo. | 0.6% | $617,500 | June 2022 | $614,000 | $575,000 | $414,500 |
| 40 | Salt Lake City, Utah | 0.5% | $552,000 | May 2022 | $549,000 | $505,000 | $345,000 |
| 41 | Pittsburgh, Pa. | 0.4% | $249,900 | June 2022 | $249,000 | $231,000 | $177,000 |
| 42 | St. Louis, Mo.-Ill. | 0.2% | $267,000 | June 2022 | $266,000 | $243,000 | $190,000 |
As the housing market continues to cool, 16 markets now significantly favor buyers
Homes that sold last month spent a median of 20 days on the market, up by one full week from this time last year and by nearly two weeks from the record low median of eight days on the market, which was set in March 2022.
The average sale-to-list price ratio, which measures how close homes are selling to their asking prices, fell to 99% in September, the lowest level since February 2021 and down from 100.3% in May, when prices peaked across the nation.
These dynamics pushed the 100 largest markets further away from seller-favorability into neutral territory last month with a slim majority of markets still favoring sellers.
Sixteen markets significantly favored buyers in September more than double from August. Austin, Texas; Boise, Idaho; Colorado Springs, Colorado; Detroit, Michigan; Jacksonville, Florida; Las Vegas, Nevada; Los Angeles, California; Nashville, Tennessee; Reno, Nevada; Ogden, Utah; Phoenix, Arizona; Riverside, California; Salt Lake City, Utah; San Diego, California; San Francisco, California; and San Jose, California, were in buyer territory last month. Thirty-three markets were neutral, offering no advantage to either sellers or buyers.
Notable among the nation's emerging buyers' markets is Las Vegas, Nevada, which is undergoing one of the largest market swings of any metro area in recent history. The major Southwestern market was the country's eighth best sellers' market during the national home price peak in May 2022. Now, after posting the largest shift toward buyer favorability of any major U.S. housing market, it is the fourth-best buyers' market.
Among other signs of recovery, movement toward buyer favorability means more homes are available for sale. Active listings (housing inventory) in these 16 markets have grown considerably faster than most other areas. Across the 100 largest markets, inventory in September rose by 4% on a year-over-year basis and 23.7% from the nationwide price peak in May.
Buyers' markets in September
| Rank | Market | Median sale price | Inventory | Inventory YoY | No. homes sold | Median days on market |
| National | $388,000 | 441,714 | 4.2% | 107,930 | 20 | |
| 1 | Phoenix-Mesa-Chandler, Ariz. | $449,000 | 19,327 | 67.7% | 2,463 | 29 |
| 2 | Ogden-Clearfield, Utah | $445,000 | 1,710 | 83.5% | 343 | 29 |
| 3 | San Francisco-Oakland-Berkeley, Calif. | $1,145,000 | 5,174 | 10.4% | 1,165 | 23 |
| 4 | Las Vegas-Henderson-Paradise, Nev. | $400,000 | 10,992 | 71.3% | 1,197 | 26 |
| 5 | Salt Lake City, Utah | $505,000 | 2,344 | 46.3% | 508 | 21 |
| 6 | San Diego-Chula Vista-Carlsbad, Calif. | $800,000 | 4,186 | 20.5% | 1,166 | 21 |
| 7 | Los Angeles-Long Beach-Anaheim, Calif. | $875,000 | 16,438 | 1.1% | 2,981 | 35 |
| 8 | Reno, Nev. | $490,000 | 2,081 | 55.9% | 300 | 26 |
| 9 | Riverside-San Bernardino-Ontario, Calif. | $530,000 | 12,304 | 16.9% | 1,961 | 32 |
| 10 | Nashville-Davidson-Murfreesboro-Franklin, Tenn. | $445,000 | 6,707 | 29.4% | 1,147 | 26 |
| 11 | Jacksonville, Fla. | $347,000 | 5,230 | 22.7% | 811 | 29 |
| 12 | San Jose-Sunnyvale-Santa Clara, Calif. | $1,400,000 | 1,659 | 7.7% | 587 | 19 |
| 13 | Detroit-Warren-Dearborn, Mich. | $250,000 | 8,553 | 8.8% | 1,973 | 18 |
| 14 | Colorado Springs, Colo. | $435,000 | 2,631 | 66.1% | 584 | 18 |
| 15 | Austin-Round Rock-Georgetown, Texas | $515,000 | 8,499 | 71.2% | 951 | 36 |
| 16 | Boise City, Idaho | $465,000 | 2,617 | 50.1% | 397 | N/A |
A slim majority of markets still favor sellers
Despite the cool-off – a majority – 51 markets -- remained sellers' markets in September, down from 83 in August. The rest were neutral, offering no advantage to either sellers or buyers.
51 sellers' markets in September
| Rank | Market | Median sale price | Inventory | Inventory YoY | Median days on market | No. homes sold |
| National | $388,000 | 441,714 | 4.2% | 20 | 107,930 | |
| 1 | Fayetteville, N.C. | $215,000 | 434 | -20.7% | 7 | 793 |
| 2 | Winston-Salem, N.C. | $245,000 | 829 | -3.4% | 7 | 407 |
| 3 | Savannah, Ga. | $296,000 | 1,157 | -11.4% | 19 | 282 |
| 4 | Little Rock-North Little Rock-Conway, Ark. | $220,000 | 1,470 | -19.9% | 14 | 355 |
| 5 | Rochester, N.Y. | $220,000 | 916 | -21.6% | 9 | 436 |
| 6 | Greensboro-High Point, N.C. | $255,000 | 949 | 5% | 8 | 455 |
| 7 | Bremerton-Silverdale-Port Orchard, Wash. | $520,000 | N/A | N/A | N/A | 445 |
| 8 | Hartford-East Hartford-Middletown, Conn. | $312,000 | 2,012 | -32.6% | 23 | 607 |
| 9 | El Paso, Texas | $228,000 | 846 | 29.8% | 7 | 316 |
| 10 | Akron, Ohio | $205,000 | 1,119 | -22.2% | 12 | 416 |
| 11 | Olympia-Lacey-Tumwater, Wash. | $465,000 | N/A | N/A | N/A | 432 |
| 12 | Albuquerque, N.M. | $315,000 | 997 | -26.8% | 16 | 481 |
| 13 | Milwaukee-Waukesha, Wis. | $300,000 | 2,867 | -33% | 33 | 774 |
| 14 | Seattle-Tacoma-Bellevue, Wash. | $675,000 | N/A | N/A | N/A | 4,932 |
| 15 | Portland-South Portland, Maine | $450,000 | 993 | 20.4% | 7 | 378 |
| 16 | Cleveland-Elyria, Ohio | $201,000 | 3,460 | -28.5% | 13 | 1,199 |
| 17 | Cincinnati, Ohio-Ky.-Ind. | $250,000 | 2,134 | -18.3% | 7 | 1,081 |
| 18 | New Haven-Milford, Conn. | $314,000 | 1,959 | -19.5% | N/A | 439 |
| 19 | Worcester, Mass.-Conn. | $390,000 | 990 | -18.5% | 9 | 450 |
| 20 | Springfield, Mo. | $230,000 | 649 | 12.3% | 9 | 326 |
| 21 | Bridgeport-Stamford-Norwalk, Conn. | $574,000 | 2,150 | -29.7% | N/A | 439 |
| 22 | Columbia, S.C. | $255,000 | 1,206 | 1.8% | 18 | 397 |
| 23 | Oklahoma City, Okla. | $237,500 | 2,059 | 8.4% | 9 | 825 |
| 24 | St. Louis, Mo.-Ill. | $243,000 | 5,370 | -4.5% | 8 | 1,702 |
| 25 | New York-Newark-Jersey City, N.Y.-N.J.-Pa. | $589,000 | 29,298 | -23% | 31 | 5,324 |
| 26 | Salisbury, Md. | $380,000 | 1,466 | -3.5% | 27 | 309 |
| 27 | Fayetteville-Springdale-Rogers, Ark. | $306,000 | 874 | 15.5% | 9 | 316 |
| 28 | Des Moines-West Des Moines, Iowa | $265,000 | 1,337 | -7.5% | 10 | 430 |
| 29 | Allentown-Bethlehem-Easton, Pa.-N.J. | $295,000 | 1,051 | -17.1% | N/A | 412 |
| 30 | Omaha-Council Bluffs, Neb.-Iowa | $277,500 | 959 | -19.5% | 7 | 471 |
| 31 | Raleigh-Cary, N.C. | $435,000 | 2,660 | 15.6% | 18 | 2,177 |
| 32 | Providence-Warwick, R.I.-Mass. | $425,000 | 2,089 | -25.9% | 20 | 699 |
| 33 | Chicago-Naperville-Elgin, Ill.-Ind.-Wis. | $305,000 | 21,818 | -21.1% | 29 | 9,201 |
| 34 | Tulsa, Okla. | $240,500 | 1,495 | 1% | 10 | 503 |
| 35 | Boston-Cambridge-Newton, Mass.-N.H. | $660,000 | 4,095 | 1.5% | 9 | 1,582 |
| 36 | Madison, Wis. | $359,900 | 1,242 | -40.3% | 31 | 357 |
| 37 | Durham-Chapel Hill, N.C. | $425,000 | 1,045 | 3.1% | 18 | 715 |
| 38 | Baton Rouge, La. | $240,000 | 1,311 | 3.1% | 14 | 287 |
| 39 | Toledo, Ohio | $172,500 | 1,379 | -14.6% | 35 | 318 |
| 40 | Houston-The Woodlands-Sugar Land, Texas | $345,000 | 13,849 | -16.2% | 19 | 5,060 |
| 41 | Asheville, N.C. | $420,000 | 2,174 | -13.6% | 23 | 313 |
| 42 | Buffalo-Cheektowaga, N.Y. | $230,000 | 1,423 | 8.1% | 12 | 427 |
| 43 | Baltimore-Columbia-Towson, Md. | $364,900 | 5,531 | -6.9% | 14 | 1,408 |
| 44 | Chattanooga, Tenn.-Ga. | $298,000 | 1,710 | -7.1% | 12 | 303 |
| 45 | Miami-Fort Lauderdale-Pompano Beach, Fla. | $449,900 | 23,675 | -0.9% | 32 | 2,293 |
| 46 | Columbus, Ohio | $300,000 | 4,835 | -15.4% | 27 | 1,199 |
| 47 | Charleston-North Charleston, S.C. | $399,000 | 3,193 | 1.4% | 21 | 525 |
| 48 | Naples-Marco Island, Fla. | $560,000 | 2,245 | 75.3% | 30 | 318 |
| 49 | Indianapolis-Carmel-Anderson, Ind. | $270,000 | 3,370 | 25.4% | 9 | 1,343 |
| 50 | Louisville/Jefferson County, Ky.-Ind. | $240,000 | 2,140 | -10.5% | 11 | 772 |
| 51 | Greenville-Anderson, S.C. | $310,000 | 2,137 | 10% | 15 | 474 |
Housing markets that still favor sellers are generally smaller - for example, only two of the top 10 sellers' markets in September (Rochester, New York and Hartford, Connecticut) have populations of more than 1 million people. As is typical in a sellers' market, active listings in most of the nation's top sellers' markets are declining. On a year-over-year basis, inventory rose in just 17 of the 51 sellers' markets.
U.S. home prices to reach new highs by May 2023, but the shift to a buyers' market will continue
By September 2023, a majority of the U.S. market will skew more toward buyers. Twenty-seven of the 100 major housing markets are projected to favor buyers, up from 16 last month. Thirty markets will be neutral, and 43 will favor sellers.
27 buyers' markets by September 2023
| Rank | Market | Current market status | Forecasted market status | Forecasted No. homes sold | Forecasted median days on market | Forecasted median sale price |
| National | Neutral | Favors Buyers | 105,100 | 36 | $414,000 | |
| 1 | Las Vegas-Henderson-Paradise, Nev. | Favors Buyers | Strongly Favors Buyers | 1,600 | 52 | $386,000 |
| 2 | Austin-Round Rock-Georgetown, Texas | Favors Buyers | Strongly Favors Buyers | 900 | 39 | $535,000 |
| 3 | Colorado Springs, Colo. | Favors Buyers | Strongly Favors Buyers | 500 | 19 | $452,000 |
| 4 | Ogden-Clearfield, Utah | Favors Buyers | Strongly Favors Buyers | 300 | 34 | $458,000 |
| 5 | Phoenix-Mesa-Chandler, Ariz. | Favors Buyers | Strongly Favors Buyers | 3,400 | 33 | $460,000 |
| 6 | San Francisco-Oakland-Berkeley, Calif. | Favors Buyers | Strongly Favors Buyers | 1,600 | 27 | $1,148,000 |
| 7 | Salt Lake City, Utah | Favors Buyers | Favors Buyers | 400 | 23 | $549,000 |
| 8 | Denver-Aurora-Lakewood, Colo. | Neutral | Favors Buyers | 1,500 | 23 | $614,000 |
| 9 | Boise City, Idaho | Favors Buyers | Favors Buyers | 400 | N/A | $448,000 |
| 10 | Los Angeles-Long Beach-Anaheim, Calif. | Favors Buyers | Favors Buyers | 3,600 | 40 | $900,000 |
| 11 | Nashville-Davidson-Murfreesboro-Franklin, Tenn. | Favors Buyers | Favors Buyers | 900 | 29 | $504,000 |
| 12 | Jacksonville, Fla. | Favors Buyers | Favors Buyers | 1,100 | 30 | $393,000 |
| 13 | San Jose-Sunnyvale-Santa Clara, Calif. | Favors Buyers | Favors Buyers | 400 | 20 | $1,443,000 |
| 14 | Lakeland-Winter Haven, Fla. | Neutral | Favors Buyers | 600 | 20 | $279,000 |
| 15 | Riverside-San Bernardino-Ontario, Calif. | Favors Buyers | Favors Buyers | 2,500 | 29 | $548,000 |
| 16 | San Diego-Chula Vista-Carlsbad, Calif. | Favors Buyers | Favors Buyers | 1,500 | 24 | $879,000 |
| 17 | Charlotte-Concord-Gastonia, N.C.-S.C. | Neutral | Favors Buyers | 1,600 | 16 | $403,000 |
| 18 | Atlanta-Sandy Springs-Alpharetta, Ga. | Neutral | Favors Buyers | 3,100 | 17 | $392,000 |
| 19 | Orlando-Kissimmee-Sanford, Fla. | Neutral | Favors Buyers | 2,000 | 15 | $431,000 |
| 20 | San Antonio-New Braunfels, Texas | Neutral | Favors Buyers | 1,100 | 28 | $361,000 |
| 21 | Portland-Vancouver-Hillsboro, Ore.-Wash. | Neutral | Favors Buyers | 1,000 | 17 | $604,000 |
| 22 | Killeen-Temple, Texas | Neutral | Favors Buyers | 300 | 14 | $306,000 |
| 23 | Reno, Nev. | Favors Buyers | Favors Buyers | 400 | 26 | $491,000 |
| 24 | Dallas-Fort Worth-Arlington, Texas | Neutral | Favors Buyers | 2,700 | 26 | $419,000 |
| 25 | Charleston-North Charleston, S.C. | Favors Sellers | Favors Buyers | 500 | 20 | $427,000 |
| 26 | Oxnard-Thousand Oaks-Ventura, Calif. | Neutral | Favors Buyers | 400 | 36 | $773,000 |
| 27 | Tampa-St. Petersburg-Clearwater, Fla. | Neutral | Favors Buyers | 3,000 | 18 | $407,000 |
Slightly over 1 million homes are forecasted to be sold between January and September 2023. The median sale price across the nation is projected to remain flat through the beginning of next year. Following to some degree the seasonal pattern of the housing market, prices will start to rise in May and are forecast to exceed $412,000 by May 2023, surpassing this year's record of $410,000. By September 2023, the number of homes for sale throughout the U.S. is to decline by 5.7% and median days will increase to 36 days.
For home buyers and prospective property investors, this could mean encountering the most favorable national market seen in recent years. For sellers, the most favorable months next year are likely to be March and April, when the market is projected to linger in neutral territory, before it starts to significantly favor buyers by June 2023.
43 sellers' markets by September 2023
| Rank | Market | Current market status | Forecasted market status | Forecasted No. homes sold | Forecasted median days on market | Forecasted median sale price |
| National | Neutral | Favors Buyers | 105,000 | 36 | $414,000 | |
| 1 | Fayetteville, N.C. | Strongly Favors Sellers | Strongly Favors Sellers | 900 | 7 | $235,000 |
| 2 | Bremerton-Silverdale-Port Orchard, Wash. | Favors Sellers | Favors Sellers | 500 | N/A | $605,000 |
| 3 | Akron, Ohio | Favors Sellers | Favors Sellers | 600 | 9 | $210,000 |
| 4 | El Paso, Texas | Favors Sellers | Favors Sellers | 400 | 7 | $256,000 |
| 5 | Winston-Salem, N.C. | Favors Sellers | Favors Sellers | 400 | 7 | $270,000 |
| 6 | Little Rock-North Little Rock-Conway, Ark. | Favors Sellers | Favors Sellers | 300 | 15 | $240,000 |
| 7 | Hartford-East Hartford-Middletown, Conn. | Favors Sellers | Favors Sellers | 600 | 22 | $339,000 |
| 8 | Rochester, N.Y. | Favors Sellers | Favors Sellers | 300 | 9 | $240,000 |
| 9 | Asheville, N.C. | Favors Sellers | Favors Sellers | 400 | 17 | $475,000 |
| 10 | Olympia-Lacey-Tumwater, Wash. | Favors Sellers | Favors Sellers | 500 | N/A | $482,000 |
| 11 | Albuquerque, N.M. | Favors Sellers | Favors Sellers | 400 | 16 | $357,000 |
| 12 | Greensboro-High Point, N.C. | Favors Sellers | Favors Sellers | 400 | 8 | $277,000 |
| 13 | Seattle-Tacoma-Bellevue, Wash. | Favors Sellers | Favors Sellers | 4,900 | N/A | $735,000 |
| 14 | Allentown-Bethlehem-Easton, Pa.-N.J. | Favors Sellers | Favors Sellers | 500 | N/A | $327,000 |
| 15 | Salisbury, Md. | Favors Sellers | Favors Sellers | 300 | 24 | $420,000 |
| 16 | Columbia, S.C. | Favors Sellers | Favors Sellers | 500 | 18 | $272,000 |
| 17 | Oklahoma City, Okla. | Favors Sellers | Favors Sellers | 800 | 9 | $251,000 |
| 18 | Savannah, Ga. | Favors Sellers | Favors Sellers | 200 | 19 | $308,000 |
| 19 | Durham-Chapel Hill, N.C. | Favors Sellers | Favors Sellers | 700 | 17 | $462,000 |
| 20 | Cincinnati, Ohio-Ky.-Ind. | Favors Sellers | Favors Sellers | 900 | 7 | $273,000 |
| 21 | Madison, Wis. | Favors Sellers | Favors Sellers | 400 | 22 | $383,000 |
| 22 | New York-Newark-Jersey City, N.Y.-N.J.-Pa. | Favors Sellers | Favors Sellers | 5,500 | 29 | $626,000 |
| 23 | New Haven-Milford, Conn. | Favors Sellers | Favors Sellers | 400 | N/A | $339,000 |
| 24 | Grand Rapids-Kentwood, Mich. | Neutral | Favors Sellers | 700 | 9 | $323,000 |
| 25 | Springfield, Mo. | Favors Sellers | Favors Sellers | 300 | 7 | $240,000 |
| 26 | Portland-South Portland, Maine | Favors Sellers | Favors Sellers | 300 | 7 | $515,000 |
| 27 | St. Louis, Mo.-Ill. | Favors Sellers | Favors Sellers | 1,400 | 7 | $266,000 |
| 28 | Providence-Warwick, R.I.-Mass. | Favors Sellers | Favors Sellers | 700 | 21 | $480,000 |
| 29 | Bridgeport-Stamford-Norwalk, Conn. | Favors Sellers | Favors Sellers | 400 | N/A | $595,000 |
| 30 | Worcester, Mass.-Conn. | Favors Sellers | Favors Sellers | 600 | 8 | $399,000 |
| 31 | Toledo, Ohio | Favors Sellers | Favors Sellers | 300 | 33 | $176,000 |
| 32 | Louisville/Jefferson County, Ky.-Ind. | Favors Sellers | Favors Sellers | 800 | 11 | $255,000 |
| 33 | Fayetteville-Springdale-Rogers, Ark. | Favors Sellers | Favors Sellers | 200 | 9 | $334,000 |
| 34 | Baton Rouge, La. | Favors Sellers | Favors Sellers | 400 | 14 | $240,000 |
| 35 | Boston-Cambridge-Newton, Mass.-N.H. | Favors Sellers | Favors Sellers | 1,600 | 8 | $692,000 |
| 36 | Houston-The Woodlands-Sugar Land, Texas | Favors Sellers | Favors Sellers | 4,700 | 22 | $381,000 |
| 37 | Milwaukee-Waukesha, Wis. | Favors Sellers | Favors Sellers | 600 | 32 | $313,000 |
| 38 | Cleveland-Elyria, Ohio | Favors Sellers | Favors Sellers | 1,100 | 11 | $215,000 |
| 39 | Chicago-Naperville-Elgin, Ill.-Ind.-Wis. | Favors Sellers | Favors Sellers | 9,200 | 31 | $324,000 |
| 40 | Tulsa, Okla. | Favors Sellers | Favors Sellers | 400 | 10 | $254,000 |
| 41 | Philadelphia-Camden-Wilmington, Pa.-N.J.-Del.-Md. | Neutral | Favors Sellers | 3,600 | 21 | $350,000 |
| 42 | North Port-Sarasota-Bradenton, Fla. | Neutral | Favors Sellers | 900 | 17 | $520,000 |
| 43 | Miami-Fort Lauderdale-Pompano Beach, Fla. | Favors Sellers | Favors Sellers | 3,000 | 34 | $516,000 |
All 100 markets buyer-seller market status
| Market | Market status September 2021 | Current Market Status | Market Status September 2023 |
| National | Strongly Favors Sellers | Neutral | Favors Buyers |
| Akron, Ohio | Strongly Favors Sellers | Favors Sellers | Favors Sellers |
| Albuquerque, N.M. | Strongly Favors Sellers | Favors Sellers | Favors Sellers |
| Allentown-Bethlehem-Easton, Pa.-N.J. | Favors Sellers | Favors Sellers | Favors Sellers |
| Asheville, N.C. | Favors Sellers | Favors Sellers | Favors Sellers |
| Atlanta-Sandy Springs-Alpharetta, Ga. | Favors Sellers | Neutral | Favors Sellers |
| Austin-Round Rock-Georgetown, Texas | Favors Sellers | Favors Buyers | Strongly Favors Sellers |
| Bakersfield, Calif. | Strongly Favors Sellers | Neutral | Neutral |
| Baltimore-Columbia-Towson, Md. | Favors Sellers | Favors Sellers | Neutral |
| Baton Rouge, La. | Favors Sellers | Favors Sellers | Favors Sellers |
| Birmingham-Hoover, Ala. | Favors Sellers | Neutral | Neutral |
| Boise City, Idaho | Favors Sellers | Favors Buyers | Favors Buyers |
| Boston-Cambridge-Newton, Mass.-N.H. | Favors Sellers | Favors Sellers | Favors Sellers |
| Bremerton-Silverdale-Port Orchard, Wash. | Favors Sellers | Favors Sellers | Favors Sellers |
| Bridgeport-Stamford-Norwalk, Conn. | Favors Sellers | Favors Sellers | Favors Sellers |
| Buffalo-Cheektowaga, N.Y. | Strongly Favors Sellers | Favors Sellers | Neutral |
| Cape Coral-Fort Myers, Fla. | Strongly Favors Sellers | Neutral | Neutral |
| Charleston-North Charleston, S.C. | Favors Sellers | Favors Sellers | Favors Buyers |
| Charlotte-Concord-Gastonia, N.C.-S.C. | Strongly Favors Sellers | Neutral | Favors Buyers |
| Chattanooga, Tenn.-Ga. | Favors Sellers | Favors Sellers | Neutral |
| Chicago-Naperville-Elgin, Ill.-Ind.-Wis. | Favors Sellers | Favors Sellers | Favors Sellers |
| Cincinnati, Ohio-Ky.-Ind. | Strongly Favors Sellers | Favors Sellers | Favors Sellers |
| Cleveland-Elyria, Ohio | Favors Sellers | Favors Sellers | Favors Sellers |
| Colorado Springs, Colo. | Strongly Favors Sellers | Favors Buyers | Strongly Favors Sellers |
| Columbia, S.C. | Strongly Favors Sellers | Favors Sellers | Favors Sellers |
| Columbus, Ohio | Favors Sellers | Favors Sellers | Neutral |
| Crestview-Fort Walton Beach-Destin, Fla. | Favors Sellers | Neutral | Neutral |
| Dallas-Fort Worth-Arlington, Texas | Favors Sellers | Neutral | Favors Buyers |
| Deltona-Daytona Beach-Ormond Beach, Fla. | Strongly Favors Sellers | Neutral | Neutral |
| Denver-Aurora-Lakewood, Colo. | Favors Sellers | Neutral | Favors Buyers |
| Des Moines-West Des Moines, Iowa | Strongly Favors Sellers | Favors Sellers | Neutral |
| Detroit-Warren-Dearborn, Mich. | Favors Sellers | Favors Buyers | Neutral |
| Durham-Chapel Hill, N.C. | Favors Sellers | Favors Sellers | Favors Sellers |
| El Paso, Texas | Strongly Favors Sellers | Favors Sellers | Favors Sellers |
| Fayetteville, N.C. | Favors Sellers | Strongly Favors Sellers | Strongly Favors Sellers |
| Fayetteville-Springdale-Rogers, Ark. | Strongly Favors Sellers | Favors Sellers | Favors Sellers |
| Grand Rapids-Kentwood, Mich. | Favors Sellers | Neutral | Favors Sellers |
| Greensboro-High Point, N.C. | Strongly Favors Sellers | Favors Sellers | Favors Sellers |
| Greenville-Anderson, S.C. | Strongly Favors Sellers | Favors Sellers | Neutral |
| Hartford-East Hartford-Middletown, Conn. | Favors Sellers | Favors Sellers | Favors Sellers |
| Houston-The Woodlands-Sugar Land, Texas | Favors Sellers | Favors Sellers | Favors Sellers |
| Indianapolis-Carmel-Anderson, Ind. | Strongly Favors Sellers | Favors Sellers | Neutral |
| Jacksonville, Fla. | Favors Sellers | Favors Buyers | Favors Buyers |
| Kansas City, Mo.-Kan. | Favors Sellers | Neutral | Neutral |
| Killeen-Temple, Texas | Strongly Favors Sellers | Neutral | Favors Buyers |
| Knoxville, Tenn. | Favors Sellers | Neutral | Neutral |
| Lakeland-Winter Haven, Fla. | Strongly Favors Sellers | Neutral | Favors Buyers |
| Las Vegas-Henderson-Paradise, Nev. | Strongly Favors Sellers | Favors Buyers | Strongly Favors Buyers |
| Little Rock-North Little Rock-Conway, Ark. | Favors Sellers | Favors Sellers | Favors Sellers |
| Los Angeles-Long Beach-Anaheim, Calif. | Favors Sellers | Favors Buyers | Favors Buyers |
| Louisville/Jefferson County, Ky.-Ind. | Favors Sellers | Favors Sellers | Favors Sellers |
| Madison, Wis. | Favors Sellers | Favors Sellers | Favors Sellers |
| Memphis, Tenn.-Miss.-Ark. | Strongly Favors Sellers | Neutral | Neutral |
| Miami-Fort Lauderdale-Pompano Beach, Fla. | Favors Sellers | Favors Sellers | Favors Sellers |
| Milwaukee-Waukesha, Wis. | Favors Sellers | Favors Sellers | Favors Sellers |
| Minneapolis-St. Paul-Bloomington, Minn.-Wis. | Favors Sellers | Neutral | Neutral |
| Myrtle Beach-Conway-North Myrtle Beach, S.C.-N.C. | Favors Sellers | Neutral | Neutral |
| Naples-Marco Island, Fla. | Strongly Favors Sellers | Favors Sellers | Neutral |
| Nashville-Davidson-Murfreesboro-Franklin, Tenn. | Favors Sellers | Favors Buyers | Favors Buyers |
| New Haven-Milford, Conn. | Favors Sellers | Favors Sellers | Favors Sellers |
| New Orleans-Metairie, La. | Favors Sellers | Neutral | Neutral |
| New York-Newark-Jersey City, N.Y.-N.J.-Pa. | Favors Sellers | Favors Sellers | Favors Sellers |
| North Port-Sarasota-Bradenton, Fla. | Strongly Favors Sellers | Neutral | Favors Sellers |
| Ocala, Fla. | Strongly Favors Sellers | Neutral | Neutral |
| Ogden-Clearfield, Utah | Favors Sellers | Favors Buyers | Strongly Favors Buyers |
| Oklahoma City, Okla. | Strongly Favors Sellers | Favors Sellers | Favors Sellers |
| Olympia-Lacey-Tumwater, Wash. | Strongly Favors Sellers | Favors Sellers | Favors Sellers |
| Omaha-Council Bluffs, Neb.-Iowa | Favors Sellers | Favors Sellers | Neutral |
| Orlando-Kissimmee-Sanford, Fla. | Strongly Favors Sellers | Neutral | Favors Buyers |
| Oxnard-Thousand Oaks-Ventura, Calif. | Favors Sellers | Neutral | Favors Buyers |
| Palm Bay-Melbourne-Titusville, Fla. | Favors Sellers | Neutral | Neutral |
| Pensacola-Ferry Pass-Brent, Fla. | Strongly Favors Sellers | Neutral | Neutral |
| Philadelphia-Camden-Wilmington, Pa.-N.J.-Del.-Md. | Favors Sellers | Neutral | Favors Sellers |
| Phoenix-Mesa-Chandler, Ariz. | Strongly Favors Sellers | Favors Buyers | Strongly Favors Buyers |
| Pittsburgh, Pa. | Favors Sellers | Neutral | Neutral |
| Port St. Lucie, Fla. | Strongly Favors Sellers | Neutral | Neutral |
| Portland-South Portland, Maine | Strongly Favors Sellers | Favors Sellers | Favors Sellers |
| Portland-Vancouver-Hillsboro, Ore.-Wash. | Strongly Favors Sellers | Neutral | Favors Buyers |
| Providence-Warwick, R.I.-Mass. | Favors Sellers | Favors Sellers | Favors Sellers |
| Raleigh-Cary, N.C. | Strongly Favors Sellers | Favors Sellers | Neutral |
| Reno, Nev. | Strongly Favors Sellers | Favors Buyers | Favors Buyers |
| Richmond, Va. | Favors Sellers | Neutral | Favors Buyers |
| Riverside-San Bernardino-Ontario, Calif. | Strongly Favors Sellers | Favors Buyers | Favors Buyers |
| Rochester, N.Y. | Favors Sellers | Favors Sellers | Favors Sellers |
| Salisbury, Md. | Strongly Favors Sellers | Favors Sellers | Favors Sellers |
| Salt Lake City, Utah | Favors Sellers | Favors Buyers | Favors Buyers |
| San Antonio-New Braunfels, Texas | Favors Sellers | Neutral | Favors Buyers |
| San Diego-Chula Vista-Carlsbad, Calif. | Favors Sellers | Favors Buyers | Favors Buyers |
| San Francisco-Oakland-Berkeley, Calif. | Favors Sellers | Favors Buyers | Strongly Favors Buyers |
| San Jose-Sunnyvale-Santa Clara, Calif. | Favors Sellers | Favors Buyers | Favors Buyers |
| Savannah, Ga. | Favors Sellers | Favors Sellers | Favors Sellers |
| Seattle-Tacoma-Bellevue, Wash. | Favors Sellers | Favors Sellers | Favors Sellers |
| Springfield, Mo. | Strongly Favors Sellers | Favors Sellers | Favors Sellers |
| St. Louis, Mo.-Ill. | Strongly Favors Sellers | Favors Sellers | Favors Sellers |
| Tampa-St. Petersburg-Clearwater, Fla. | Strongly Favors Sellers | Neutral | Favors Buyers |
| Toledo, Ohio | Favors Sellers | Favors Sellers | Favors Sellers |
| Tucson, Ariz. | Favors Sellers | Neutral | Neutral |
| Tulsa, Okla. | Strongly Favors Sellers | Favors Sellers | Favors Sellers |
| Urban Honolulu, Hawaii | Strongly Favors Sellers | Neutral | Neutral |
| Winston-Salem, N.C. | Strongly Favors Sellers | Favors Sellers | Favors Sellers |
| Worcester, Mass.-Conn. | Strongly Favors Sellers | Favors Sellers | Favors Sellers |
Buyer-Seller Market Index methodology
The Buyer-Seller Market Index was developed by Knock to measure the degree to which the nation's largest, most active housing markets favor home sellers or home buyers. It combines six measures of the housing market, covering six years of monthly data between January 2017 and September 2022.
By observing trends in these measures in major U.S. cities, the Index can forecast housing market conditions 12 months from now, helping homeowners, prospective home buyers and property investors make more educated decisions in the U.S. housing market.
The index uses data on more than 150 million properties in the nation's 100 largest metro areas in terms of total home sales from the last six years. The data was obtained from housing database The Multiple Listing Service, using the National Association of Realtors' Real Estate Transaction Standards (RETS) API.
Index values range from -4 to 4, with lower negative values indicating a relatively favorable market for buyers and higher positive values indicating a relatively favorable market for sellers. Index values ranging around zero denote a somewhat neutral market. Data is not seasonally adjusted.
The six equally-weighted measures for the nation's top 100 markets (metros) each represent five years of monthly data:
1. Average sale to ask price ratio – Calculation: Average of each sale price / list price ratio
2. Homes Sold – Number of homes sold
3. Inventory – Number of active listings
4. Median Days on Market – Median number of days between when a property is listed and when it is taken off the market (Median days on market data is not available for seven of the 100 largest markets (Boise, Idaho; Richmond, Virginia; Seattle; Allentown, Pennsylvania; Portland, Maine; New Haven, Connecticut; and Bridgeport, Connecticut.)
5. Median Sale Price – Middle of the sale price distribution
6. Months Supply – Calculation: # active listings / 6-month rolling average sales