
CoreLogic HPI Forecasts
HPI National Change
November 2021 National Home Prices
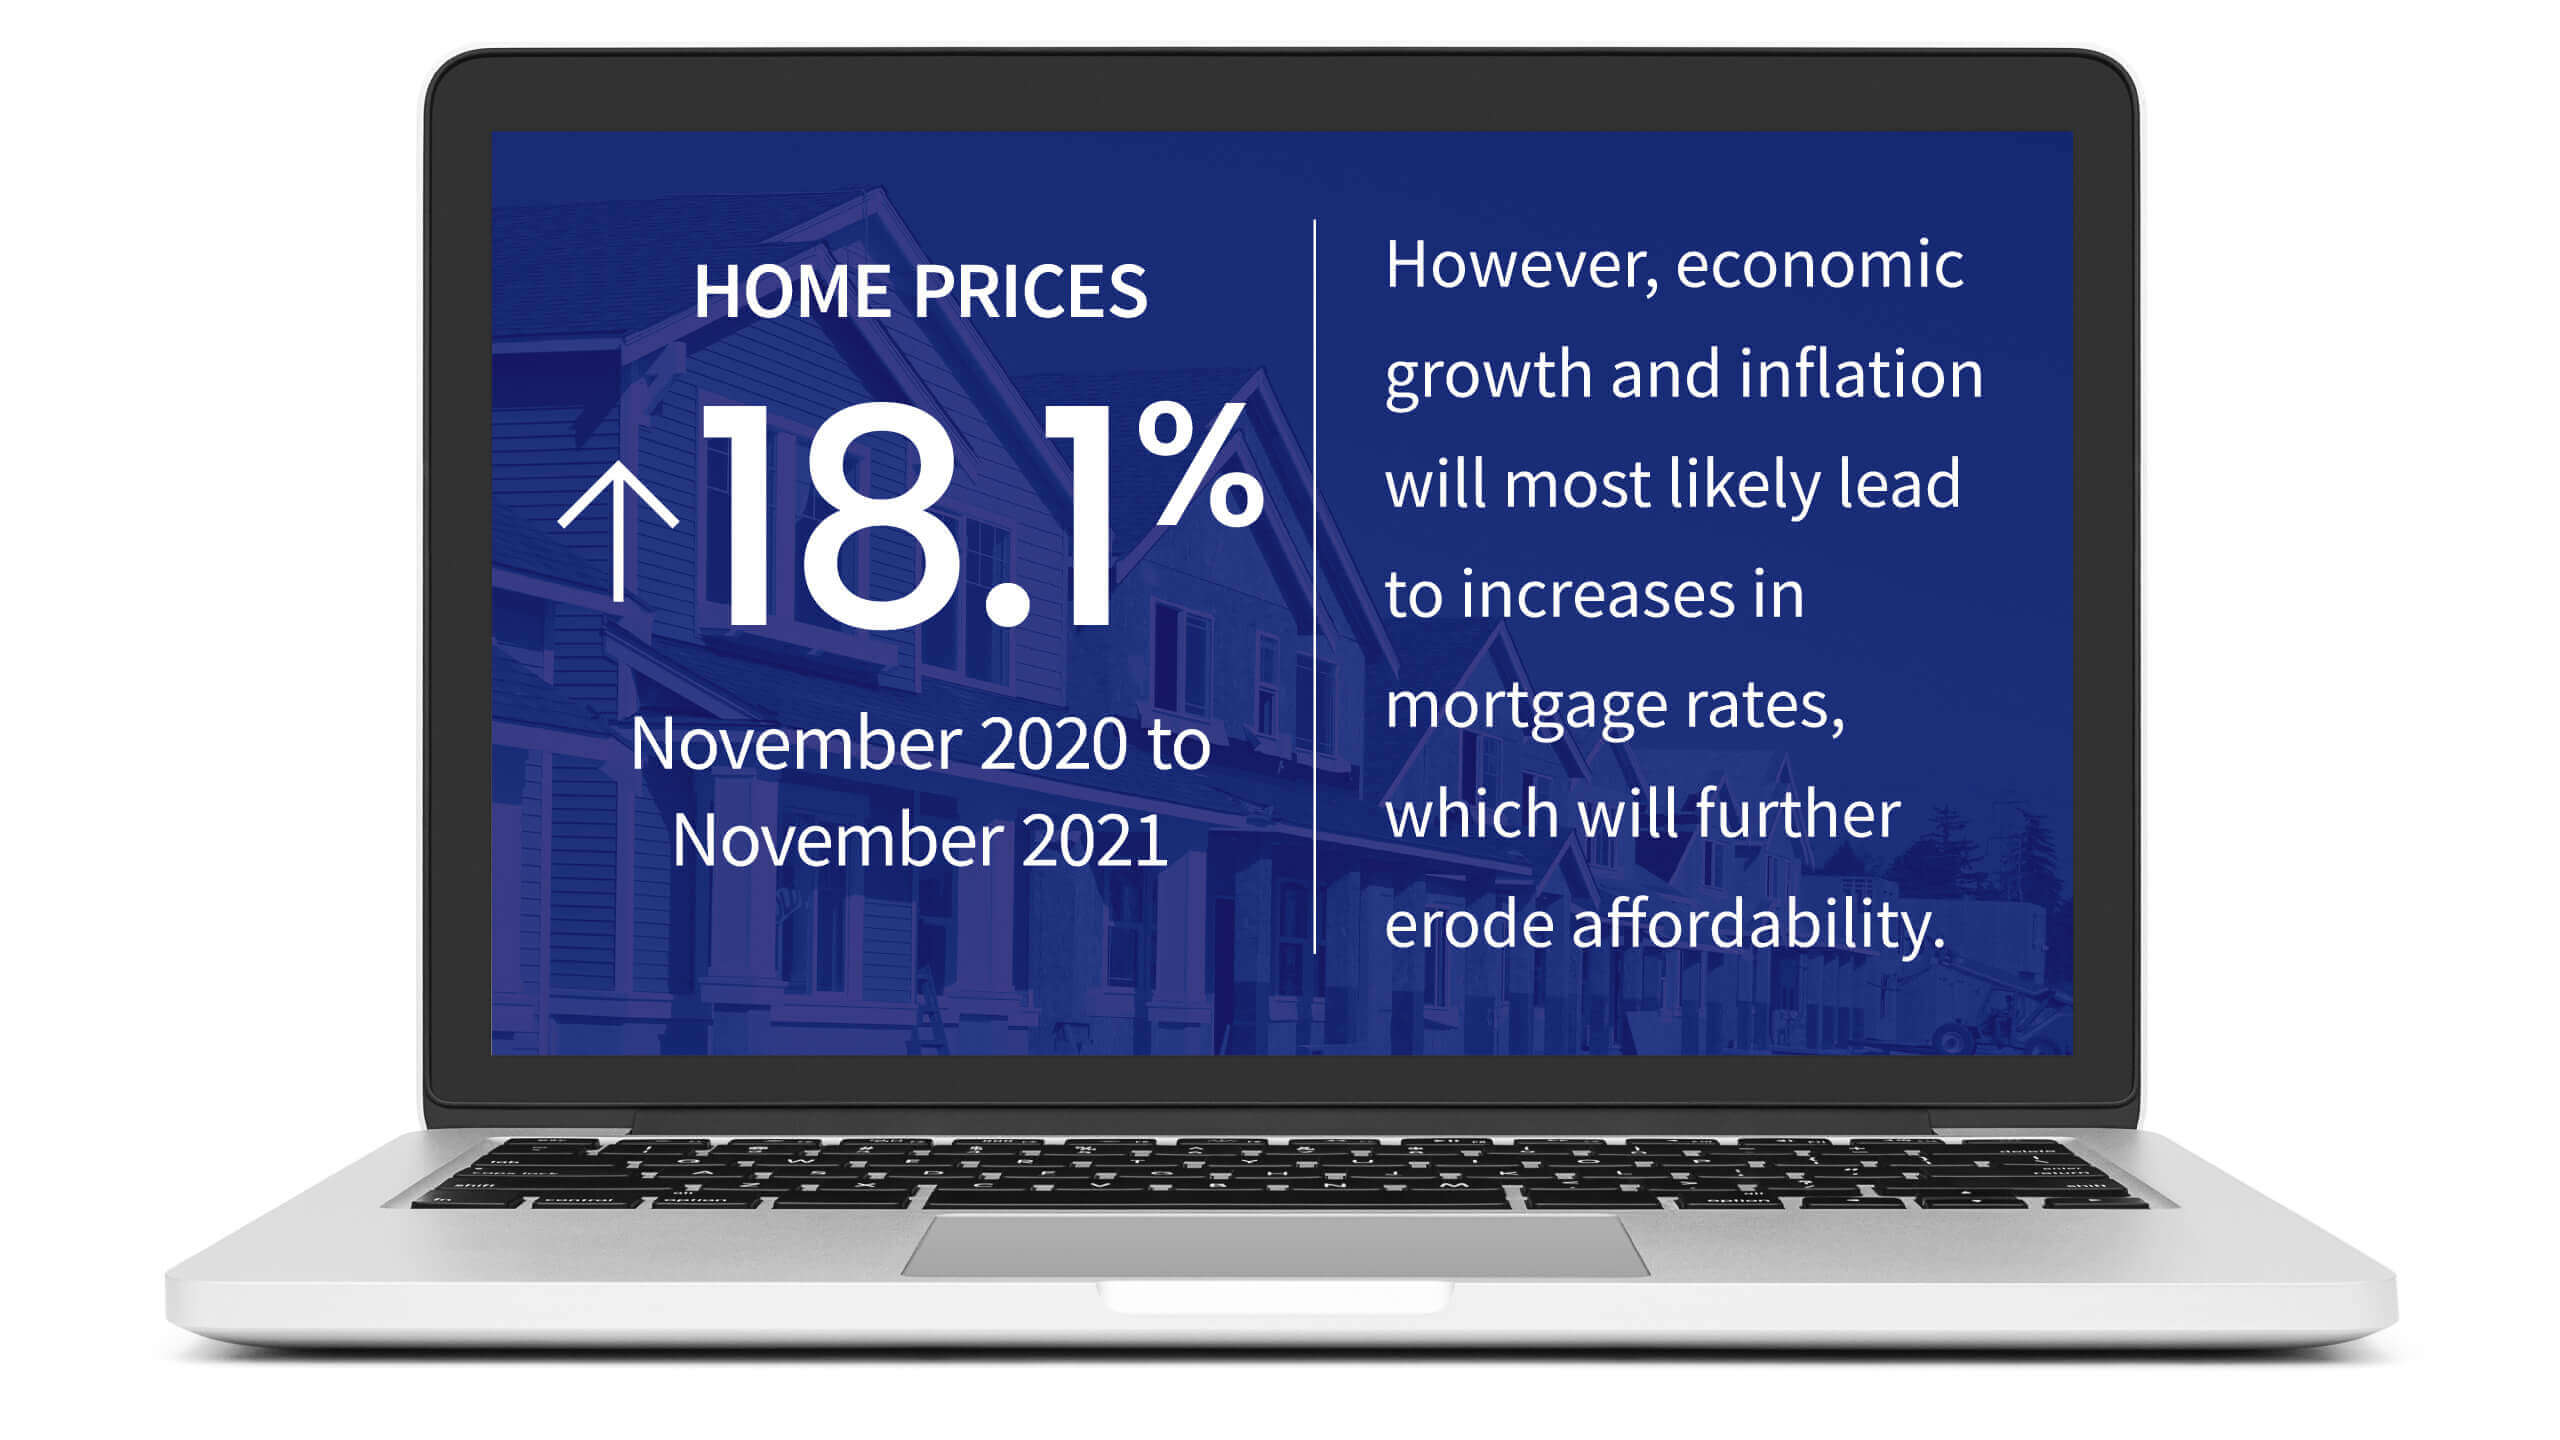
Home prices nationwide, including distressed sales, increased year over year by 18.1% in November 2021 compared with November 2020. On a month-over-month basis, home prices increased by 1.3% in November 2021 compared with October 2021 (revisions with public records data are standard, and to ensure accuracy, CoreLogic incorporates the newly released public data to provide updated results).
Forecast Prices Nationally
The CoreLogic HPI Forecast indicates that home prices will remain flat on a month-over-month basis from November 2021 to December 2021, and increase on a year-over-year basis by 2.8% from November 2021 to December 2022.

“Over the past year, we have seen one of the most robust seller’s markets in a generation. While increased interest rates may help cool down homebuying activity, we expect 2022 to be another strong year with continuing upward price growth.”
-Frank Martell
President and CEO of CoreLogic
HPI & Case-Shiller Trends
This graph shows a comparison of the national year-over-year percent change for the CoreLogic HPI and CoreLogic Case-Shiller Index from 2000 to present month with forecasts one year into the future. We note that both the CoreLogic HPI Single Family Combined tier and the CoreLogic Case-Shiller Index are posting positive, but moderating year-over-year percent changes, and forecasting gains for the next year.

Economic Impact on Home Prices
While 2021 was a record-breaking year for U.S. home price growth, for many prospective buyers the hot housing market will continue to exacerbate ongoing affordability challenges into the new year — and beyond. Though home price growth remains at historic highs, it is projected to slow over the next year. However, economic growth and inflation will most likely lead to increases in mortgage rates, which will further erode affordability.
“Interest rates on 30-year fixed-rate mortgages averaged a record low of 2.96% during 2021, helping to keep monthly payments low in the face of record-high home prices. However, the Federal Reserve appears poised to allow interest rates to rise in 2022. Higher rates will intensify buyer affordability challenges, especially in overvalued local markets.”
– Dr. Frank Nothaft
Chief Economist for CoreLogic
HPI National and State Maps – November 2021
The CoreLogic HPI provides measures for multiple market segments, referred to as tiers, based on property type, price, time between sales, loan type (conforming vs. non-conforming) and distressed sales. Broad national coverage is available from the national level down to ZIP Code, including non-disclosure states.
Nationally, home prices increased 18.1% year over year in November. No states posted an annual decline in home prices. The states with the highest increases year-over-year were Arizona (28.6%), Florida (25.8%), and Idaho (25.5%).

HPI Top 10 Metros Change
The CoreLogic HPI provides measures for multiple market segments, referred to as tiers, based on property type, price, time between sales, loan type (conforming vs. non-conforming) and distressed sales. Broad national coverage is available from the national level down to ZIP Code, including non-disclosure states.
These large cities continue to experience price increases in November, with Phoenix leading the way at 30.5% year over year.

Markets to Watch: Top Markets at Risk of Home Price Decline
The CoreLogic Market Risk Indicator (MRI), a monthly update of the overall health of housing markets across the country, predicts that metros such Prescott, Arizona; Worcester, Massachusetts; and Lake Havasu-Kingman, Arizona, are at the highest risk (50-70% probability) of a decline in home prices over the next 12 months. Merced, California, and Springfield, Massachusetts, are also at moderate risk (25-50%) of a decline.

Summary
CoreLogic HPI features deep, broad coverage, including non-disclosure state data. The index is built from industry-leading real-estate public record, servicing, and securities databases—including more than 40 years of repeat-sales transaction data—and all undergo strict pre-boarding assessment and normalization processes.
CoreLogic HPI and HPI Forecasts both provide multi-tier market evaluations based on price, time between sales, property type, loan type (conforming vs. non-conforming) and distressed sales, helping clients hone in on price movements in specific market segments.
Updated monthly, the index is the fastest home-price valuation information in the industry—complete home-price index datasets five weeks after month’s end. The Index is completely refreshed each month—all pricing history from 1976 to the current month—to provide the most up-to-date, accurate indication of home-price movements available.