South Florida Inventory Search

South Florida Inventory Search
Click to Search the Complete South Florida Property Inventory

Thursday, December 22, 2022

Florida's November R.E. Market: Higher Inventory and Prices, but Lower Sales

 By Marla Martin

Florida Realtors: Nov. closed single-family sales fell 38.2% in the face of rising interest rates, but for-sale inventory increased 105.2% to create a 2.8-months’ supply.

ORLANDO, Fla. – Florida’s housing market reported more inventory (active listings) and higher median prices in November compared to a year ago, though inflation and interest rates above 6% continued to influence buyer demand, according to Florida Realtors®’ latest housing data.

Closed sales of single-family homes statewide last month totaled 17,009, down 38.2% year-over-year, while existing condo-townhouse sales totaled 7,084, down 38.9% from November 2021, according to data from Florida Realtors Research Department in partnership with local Realtor boards/associations. Closed sales may occur from 30- to 90-plus days after sales contracts are written.

According to Florida Realtors Chief Economist Dr. Brad O’Connor, Freddie Mac’s weekly national mortgage market survey showed that the average 30-year fixed mortgage rate rose above 6% in mid-September and crested at about 7% in late October, where it remained for the next three weeks. Since then, it has fallen somewhat but remains above 6% – a rate level not seen since late 2008.

“The effect of these higher rates on homebuyer demand throughout the U.S. this fall was not a positive one,” O’Connor says. “Here in Florida, we could already see that conditions were worsening in response to the rise in rates above 6% in October’s housing market data. Based on those figures, it’s not surprising that the newly released November figures for closed sales from Florida Realtors exhibit similar declines – and we should probably expect similar declines in closed sales for December, as well, given that rates were at their recent peak near 7% for much of November, when many of the homes scheduled to close in December were going under contract.

“This is reflected in the year-over-year changes in new pending sales reported for November: a decline of 36.8% for single-family homes, and 42.1% drop for townhouses and condos.”

In the wake of the higher interest rates, the rate of price growth for Florida’s home sales continued to slow but remained above the long-term trend, O’Connor noted.

In November, the statewide median sales price for single-family existing homes was $400,000, up 9.6% from the previous year; for condo-townhouse units, it was $307,000, up 12.3% over the year-ago figure. The median is the midpoint; half the homes sold for more, half for less.

“In many local markets across the state, we’re starting to see more for-sale inventory, which gives previously frustrated buyers more opportunities,” said 2022 Florida Realtors President Christina Pappas, vice president of the Keyes Family of Companies in Miami. “Homes in Florida continue to go under contract quickly, though the time to contract continues to increase: The median time to contract for single-family existing homes last month was 29 days compared to 11 days during the same month a year ago. The median time to contract for existing condo-townhouse units was 27 days compared to 15 days in November 2021.”

Statewide inventory was higher last month than a year ago for both existing single-family homes, increasing by 105.2%, and for condo-townhouse units, up 47.4%. The supply of single-family existing homes increased to a 2.8-months’ supply while existing condo-townhouse properties were at a 2.7-months’ supply in November.

© 2022 Florida Realtors®

NAR: November U.S. Home Sales Down 35.4% Year-to-Year

 By Kerry Smith

Even with fewer sales, the median home price was up 3.5% year-to-year. Month-to-month, home sales were down 7.7% and there’s a 3.3-months’ supply of inventory.

WASHINGTON – Existing-home sales declined for the tenth month in a row in November, according to the National Association of Realtors® (NAR). All four major U.S. regions included in NAR’s monthly reports recorded month-over-month and year-over-year declines.

Total existing-home sales – completed transactions that include single-family homes, townhomes, condominiums and co-ops – waned 7.7% from October to a seasonally adjusted annual rate of 4.09 million in November. Year-over-year, sales dwindled by 35.4% (down from 6.33 million in November 2021).

“In essence, the residential real estate market was frozen in November, resembling the sales activity seen during the COVID-19 economic lockdowns in 2020,” says NAR Chief Economist Lawrence Yun. “The principal factor was the rapid increase in mortgage rates, which hurt housing affordability and reduced incentives for homeowners to list their homes. Plus, available housing inventory remains near historic lows.”

Total housing inventory at the end of November was 1.14 million units, down 6.6% from October but up 2.7% from one year ago (1.11 million). Unsold inventory sits at a 3.3-month supply at the current sales pace. That’s identical to October but up from 2.1 months in November 2021.

The median existing-home price for all housing types in November was $370,700, a 3.5% increase from November 2021 ($358,200). Prices rose in all regions, marking 129 consecutive months of year-over-year increases – the longest-running streak on record.

Properties typically remained on the market 24 days in November, up from 21 days in October and 18 days in November 2021. Two out of three (61%) homes sold in November 2022 were on the market for less than a month.

First-time buyers were responsible for 28% of sales in November – unchanged from October, but up from 26% in November 2021.

All-cash sales accounted for 26% of transactions in November – identical to October and up from 24% in November 2021.

Individual investors or second-home buyers, who make up many cash sales, purchased 14% of homes in November, down from 16% in October and 15% in November 2021.

Distressed sales – foreclosures and short sales – represented 2% of sales in November, virtually unchanged month-to-month and year-to-year.

According to Freddie Mac, the 30-year fixed-rate mortgage averaged 6.31% as of December 15. That’s down from 6.33% the week before but up from 3.12% one year ago.

“The market may be thawing since mortgage rates have fallen for five straight weeks,” Yun says. “The average monthly mortgage payment is now almost $200 less than it was several weeks ago when interest rates reached their peak for this year.”

Single-family and condo/co-op sales: Single-family home sales declined to a seasonally adjusted annual rate of 3.65 million in November, down 7.6% from 3.95 million in October and 35.2% from one year ago. The median existing single-family home price was $376,700 in November, up 3.2% from November 2021.

Existing condominium and co-op sales were recorded at a seasonally adjusted annual rate of 440,000 units in November, down 8.3% from October and 37.1% from the previous year. The median existing condo price was $321,600 in November, an annual increase of 5.8%.

“For most of this year, prospective homebuyers have faced the dual challenges of elevated mortgage rates and limited housing inventory,” says NAR President Kenny Parcell. “Consumers can rely on Realtors to provide informed guidance on changing market conditions and trusted expertise throughout all steps of the home buying process.”

Regional breakdown: Existing-home sales in the Northeast decreased 7.0% from October to an annual rate of 530,000 in November, down 28.4% from November 2021. The median price in the Northeast was $394,700, an increase of 3.5% from the prior year.

Existing-home sales in the Midwest retreated 5.6% from the previous month to an annual rate of 1.02 million in November, falling 30.6% from one year ago. The median price in the Midwest was $268,600, up 3.9% from November 2021.

In the South, existing-home sales dwindled 7.1% in November from October to an annual rate of 1.84 million, a 35.0% decrease from the previous year. The median price in the South was $340,100, an increase of 4.4% from this time last year.

Existing-home sales in the West fell 12.5% from October to an annual rate of 700,000 in November, down 45.7% from one year ago. The median price in the West was $569,800, a 2.0% increase from November 2021.

“The West region experienced the largest decline in home sales and the smallest increase in home prices compared to the other regions of the country,” says Yun.

© 2022 Florida Realtors®

Wednesday, December 21, 2022

Multifamily units under construction reached a near 50-year high in November, but is weakening.

 By Kerry Smith

WASHINGTON – Single-family housing starts continued to fall in November, with the pace of construction down 32% since February, the month when mortgage rates began to rise.

The housing market continues to weaken as higher construction costs, elevated interest rates and flagging demand harm housing affordability. The count of multifamily units under construction reached a near 50-year high in November, but even there multifamily permit growth is weakening.

Overall housing starts decreased 0.5% to a seasonally adjusted annual rate of 1.43 million units in November, according to a report from the U.S. Department of Housing and Urban Development and the U.S. Census Bureau.

The November reading of 1.43 million starts is the number of housing units builders would begin if development kept this pace for the next 12 months.

Within that overall number, single-family starts decreased 4.1% to an 828,000 seasonally adjusted annual rate. Year-to-date (10 months, January to November), single-family starts are down 9.4%. The multifamily sector, which includes apartment buildings and condos, increased 4.9% to an annualized 599,000 pace.

“It’s no surprise that single-family starts are running at their lowest level since May 2020, given that builder sentiment has dropped for 12 consecutive months as builders remain fixated on rising building material costs and supply chain bottlenecks, with electrical transformers in particular being in short supply,” says Jerry Konter, chairman of the National Association of Home Builders (NAHB).

“One important characteristic of the single-family housing market is that there have been more single-family homes that completed construction than have been started over the past four months,” says NAHB Chief Economist Robert Dietz. “The most recent data for November shows there were 25,500 more single-family homes completed than started, thus pushing down the number of new homes under construction.”

On a regional and year-to-date basis, combined single-family and multifamily starts are 1.3% higher in the Northeast, 0.8% higher in the Midwest, 0.6% higher in the South and 7.0% lower in the West.

Overall permits decreased 11.2% to a 1.34 million unit annualized rate in November. Single-family permits decreased 7.1% to a 781,000 unit rate. Multifamily permits decreased 16.4% to an annualized 561,000 pace, the lowest reading for apartment permits since September 2021.

Looking at regional permit data on a year-to-date basis, permits are 5.6% lower in the Northeast, 0.5% lower in the Midwest, 0.6% lower in the South and 6.5% lower in the West.

The number of multifamily units under construction for November is 932,000 – the highest number since December 1973. The number of single-family units under construction has fallen for six consecutive months, declining to 777,000 homes in November.

© 2022 Florida Realtors®

Tuesday, December 20, 2022

Report: Florida Will Need 570,000 Housing Units by 2030

 From ClickOrlando.com

The great weather, paired with the "work-from-anywhere" dynamic brought about by the pandemic, continues to bring more people to the Sunshine State, according to the FAA.

The Florida Apartment Association (FAA) has launched a new website, BuildFlorida2030.com, that tracks the state's growing housing needs and includes a dashboard that tracks the percentage of renters, as well as a breakdown of land and construction costs by county.

"I think the big key takeaway is that Florida ... has been growing at a tremendous rate over the past decade or so," said Amanda White with the FAA. "Between 2010 and 2020 for example, the state grew by 15%, which amounts to 2.7 million people, (and) rank(s) second overall (in-state growth) after Texas."

According to the data, the Orlando-Kissimmee-Sanford metro area has a shortage of 10,000 apartment units.

By 2030, Florida's population is projected to grow by 3.2 million, which means the state needs 570,000 housing units by then.

“I think the pandemic really changed the dynamic and people are able to work from anywhere and I think a lot of states in the Sunbelt like Florida that have great weather, beautiful, natural resources and beaches and things of that nature, I think it really attracted folks to live where they want to live,” White said.

Source: "Florida will need 500K housing units by 2030 with growing population, experts say," ClickOrlando.com

Friday, December 16, 2022

2023 Real Estate Market: Less Sales, Stable Prices

 By Marla Martin

NAR Chief Economist Yun’s forecast represents a drop of about 6.8% from this year’s sales; he expects the median home price to rise just 0.3% from this year to $385,800.

WASHINGTON – Lawrence Yun, NAR chief economist and senior vice president of research for the National Association of Realtors® (NAR), forecasts that 4.78 million existing homes will be sold, prices will remain stable and Atlanta will be the top real estate market to watch in 2023 and beyond.

Yun unveiled the association's forecast during NAR's fourth annual year-end Real Estate Forecast Summit.

Yun predicts home sales will decline by 6.8% compared to 2022 (5.13 million) and the median home price will reach $385,800 – an increase of just 0.3% from this year ($384,500).

“Half of the country may experience small price gains, while the other half may see slight price declines,” Yun said. “However, markets in California may be the exception, with San Francisco, for example, likely to register price drops of 10–15%.”

Yun expects rent prices to rise 5% in 2023, following a 7% increase in 2022. He predicts foreclosure rates will remain at historically low levels in 2023, comprising less than 1% of all mortgages.

Yun forecasts U.S. GDP will grow by 1.3%, roughly half the typical historical pace of 2.5%. After eclipsing 7% in late 2022, he expects the 30-year fixed mortgage rate to settle at 5.7% as the Fed slows the pace of rate hikes to control inflation. Yun noted this is lower than the pre-pandemic historical rate of 8%.

Top 10 real estate markets to watch in 2023 and beyond

NAR identified 10 real estate markets that it expects to outperform other metro areas in 2023. In order, the markets are as follows:

  1. Atlanta-Sandy Springs-Marietta, Georgia
  2. Raleigh, North Carolina
  3. Dallas-Fort Worth-Arlington, Texas
  4. Fayetteville-Springdale-Rogers, Arkansas-Missouri
  5. Greenville-Anderson-Mauldin, South Carolina
  6. Charleston-North Charleston, South Carolina
  7. Huntsville, Alabama
  8. Jacksonville, Florida
  9. San Antonio-New Braunfels, Texas
  10. Knoxville, Tennessee

“The demand for housing continues to outpace supply,” Yun said. “The economic conditions in place in the top 10 U.S. markets, all of which are located in the South, provide the support for home prices to climb by at least 5% in 2023.”

NAR selected the top 10 real estate markets to watch in 2023 based on how they compared to the national average on the following economic indicators: 1) better housing affordability; 2) greater numbers of renters who can afford to buy a median-priced home; 3) stronger job growth; 4) faster growth of information industry jobs; 5) higher shares of the information industry in the respective local GDPs; 6) migration gains; 7) shares of workers teleworking; 8) faster population growth; 9) faster growth of active housing inventory; and 10) smaller housing shortages.

For more info, see NAR’s, On the Horizon: Markets to Watch in 2023 and Beyond report.

© 2022 Florida Realtors®

Wednesday, December 14, 2022

More than $3.69B in federal grants, disaster loans and flood insurance money has been provided to Florida

 By Kerry Smith

WASHINGTON – According to the latest information released by the Federal Emergency Management Administration (FEMA), National Flood Insurance Program (NFIP) policyholders have received more than $1.2 billion so far for Hurricane Ian recovery. Since landfall, more than 46,000 policyholders have filed claims.

Including the NFIP insurance money, the state and its residents have received more than $3.69 billion in federal grants, disaster loans, and flood insurance payments. FEMA says it provided $814 million to households and $401 million toward the state’s emergency response; the U.S. Small Business Administration provided $1.2 billion in disaster loans, and the National Flood Insurance Program has paid $1.25 billion in claims.

Under flood insurance, more than $237 million was in the form of advance payments. Policyholders could receive up to $20,000 immediately after filing a claim, and over 10,000 policyholders did so.

FEMA latest estimated expected total for Hurricane Ian flood insurance claims is between $3.7 and $5.2 billion. Those losses include flood insurance claims received from five states, though the majority came from Florida.

“The $1.2 billion paid to NFIP policyholders represents our continued commitment to this critical mission and underscores the importance of purchasing flood insurance,” says FEMA Administrator Deanne Criswell. “That’s why we continue to encourage Floridians who may have let their flood insurance coverage lapse to take advantage of our extended grace period and renew their coverage today by contacting their insurance company or agent.”

In October, NFIP extended the grace period to renew NFIP policies from 30 days to 90 days for certain Florida policyholders in some counties. As of this week, homeowners with flood policies that expired between mid-September and October 23, 2002, can still extend their policy and receive reimbursement for flooding.

FEMA estimates that over 8,000 Florida NFIP policyholders are included in this renewal grace period but have not yet done so. Those who wish to take renew during the extended grace period for Hurricane Ian should contact their agent or insurance company. Policyholders who do not have their insurance agent or company’s contact information should call (877) 336-2627 for assistance.

To learn more about how to file a flood insurance claim visit floodsmart.gov.

© 2022 Florida Realtors®

Monday, December 12, 2022

Today’s Market? The Great Stabilization

 By Jennifer Warner

Florida Realtors economist: The RE market changed rapidly this year, and the frenzy to buy-sell faded as more owners and renters decided to just stay where they are.

ORLANDO, Fla – What really unleashed demand for housing over the last few years more than Covid-related remote-work policies? Record low interest rates that expanded all buyers’ purchasing power.

First-time buyers in particular didn’t have the benefit of existing equity to make a down payment, and they were able to get into the game as affordability and low-borrowing costs combined to make deals a sudden reality. It created a somewhat “magical time” in residential real estate.

The result: Some 85% of U.S. homeowners with mortgages currently have an interest rate less than 5%, according to Redfin. That’s a lot of people who are not incentivized to transact if there isn’t some other pressing need to move.

By and large, potential sellers missed the peak pricing achieved by homeowners who sold earlier. And buyers have seen their purchasing power diminish over the last 12 months as interest rates steadily increased at one of the fastest paces the market has seen in a long time. While the level today isn’t altogether painful relative to some earlier times, the pace of rate hikes has been exceedingly problematic.

Buyers are wary about taking on a high-priced home at a higher interest rate. Sellers are holding onto their homes secured with low interest rates, not wanting to enter a marketplace that has become exceedingly more expensive. A mortgage taken out at the peak of the market in July 2022 was $1,877 – 44% more per month than 2020’s lowest point.

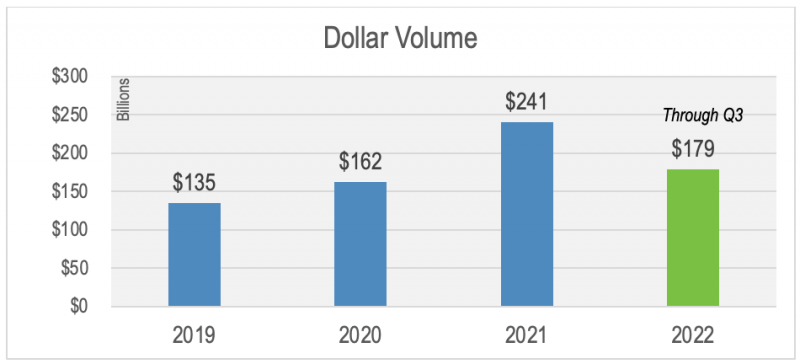
Dollar volume for transactions is reflective of this stabilization among buyers and sellers. Through the third quarter of 2022, the total dollar volume for sales in Florida is around $179 billion. This is still a very strong year overall that’s surpassing what we thought was a dynamite year in 2020 – but won’t exceed 2021’s banner year.

Chart shows dollar volume of Florida home sales from 2019 to 2022

What’s a Realtor to do?

This means that the market will likely start to have some sanity in it again. Gone are deals that hardly make sense, waived contingencies and inspections, and offers tens of thousands over ask. As you start to make your plans for 2023, think back to the strategies that made you successful in 2019.

Also remember that residential real estate is different in many ways to most commodity markets in that people will still transact as life circumstances changes. Families will still expand and contract; people will still move for their jobs; people will still invest in the American Dream of homeownership. Knowing the obstacles people face will help you bring creativity to the table when working in this new economic climate. Know what you’re up against and make a plan to survive and, ultimately, thrive.

How did we get here?

The Covid pandemic kicked off one the largest population shifts in recent history. We wrote about it back in 2021, highlighting many of the reasons people decided to change their living situations. For them, this could mean finally making that move to the suburbs or even making that move to a new state. Not only did freedom from a daily commute upend where people lived, but so did buyer’s preferences. Condensed, urban living was readily traded in for locales with more space.

This magical time, with interest rates at or below 3%, lasted from about August 2020 until January 2022. Prices didn’t really start picking up steam in Florida until around the fourth quarter of 2020, but the low rates helped keep the monthly payment affordable.

The monthly payment for a median-priced home ($315,000) in August 2020 when interest rates were at 3% was $1,059. By January 2022, prices had increased by about 14% to around $365,000, and with the interest rate still holding around 3%, it made that payment increase in kind by 15% to $1,243.

This magical time got a lot of people into homes for the first time, allowed them to sell their starter home and move into a larger home, or refinance their existing mortgage to a much lower rate. Total dollar volume in Florida reflects this boom time. In 2019, total sales volume for all property types was relatively in line with historical norms at around $135 billion for all property types. In 2020, dollar volume climbed by 20% year over year. Still, 2021 was even stronger, with dollar volume smashing historic norms by growing 48% year over year, or about 78% over 2019’s already strong number.

Jennifer Warner is an economist and Florida Realtors Director of Economic Development

© 2022 Florida Realtors®

Thursday, December 8, 2022

Fake Sellers, Fake Landlords: What’s Real Anymore?

 By Meredith Caruso

The advice for anyone you meet in real estate? Trust but verify – which means don’t fully trust anyone who isn’t your mother. Scammers continually find new ways to separate you, your buyer or your seller from their money.

ORLANDO, Fla. – Florida Realtors has sent out several articles concerning the uptick in scammers, whether that be a fake seller of vacant land or a fake landlord who doesn’t actually own the rental property or tips on how to avoid being scammed. Watch for red flags so this doesn’t happen in your transaction. (Also see: Scam Involving Sale of Vacant Lots is Back: Don’t Get Fooled Again!) There is also the twist where scammers fraudulently change the corporate docs online in attempt to get you to think they are who they claim they are.

But what can you do should you actually catch the fraudulent transaction? Depending on the details of what occurred in the scam, you may have different options. For example, a false landlord posting on Zillow can be reported to Zillow directly so the offending post can be removed. If this is something posted on the MLS, contact the MLS.

The Internet Crime Complaint Center (IC3) was created in 2000 by a task force that includes the Federal Bureau of Investigations (FBI), National White Collar Crime Center (NW3C) and the Bureau of Justice Assistance (BJA).

Per the IC3 website, www.ic3.gov, the “mission of the Internet Crime Complaint Center is to provide the public with a reliable and convenient reporting mechanism to submit information to the Federal Bureau of Investigation concerning suspected Internet-facilitated criminal activity and to develop effective alliances with law enforcement and industry partners. Information is analyzed and disseminated for investigative and intelligence purposes to law enforcement and for public awareness.”

While IC3 tackles other types of crimes, this article focuses on internet crime specifically so it’s important to recognize how that is defined. The website clarifies this in its FAQs as “any illegal activity involving one or more components of the Internet, such as websites, chat rooms, and/or email. Internet crime involves the use of the Internet to communicate false or fraudulent representations to consumers. These crimes may include, but are not limited to, advance-fee schemes, non-delivery of goods or services, computer hacking, or employment/business opportunity schemes.”

How could this appear in the real estate world? Fake listings or wire fraud scams via email, for example, would qualify.

Who can file a complaint with IC3? Either the person directly affected by the fraud or someone on their behalf is able to file a complaint. They will ask for:

  • The victim’s name, address, telephone number and email address (your information if you’re the victim, someone else’s info if you’re filing the complaint on their behalf of another person)
  • Any financial transaction information (i.e. account information, transaction date and amount and who received the money)
  • The subject’s (aka alleged scammer) name and any information you have about them (name, address, telephone, email, website, IP address)
  • Specific details on what occurred and any other information to support your complaint

Keep all documentation regarding the situation. Should the appropriate authorities conduct an investigation, you’ll have copies readily available. 

It’s also important to note that the IC3 doesn’t conduct any investigations. It sends the complaint information to the relevant oversight authorities for them to do so.

Per the IC3 website, types of evidence that could become useful in the course of an investigation may include, but are not limited to:

  • Canceled checks
  • Credit card receipts
  • Money order receipts
  • Certified or other mail receipts
  • Wire receipts
  • Virtual currency receipts
  • Pre-paid card receipts
  • Envelopes (if you received items via FedEx, UPS, or U.S. Mail)
  • Facsimiles
  • Pamphlets or brochures
  • Phone bills
  • Printed or preferably electronic copies of emails (if printed, include full email header information)
  • Printed or preferably electronic copies of web pages
  • Hard drive images
  • PCAP files containing malicious network traffic
  • Network, host system, and/or security appliance logs
  • Copies of malware
  • Chat transcripts and/or telephone logs

Meredith Caruso is Associate General Counsel for Florida Realtors
Note: Information deemed accurate on date of publication

Wednesday, December 7, 2022

Property Insurance Issues Teed Up for Special Session

 By Jim Saunders

A special session of the Florida Legislature meets next week, and lawmakers issued a formal proclamation saying they will consider hot-button insurance issues.

TALLAHASSEE, Fla. – With Florida’s property-insurance system in turmoil, state lawmakers could be poised to take major steps to try to stabilize the market during a special legislative session next week.

Senate President Kathleen Passidomo, R-Naples, and House Speaker Paul Renner, R-Palm Coast, released a formal session proclamation Tuesday that indicated lawmakers will consider a series of hot-button insurance issues.

According to information from Florida Realtors’ Public Policy office, those goals include:

  • Reducing the cost of litigation regarding property insurance claims.
  • Fostering the availability of reinsurance for property insurance.
  • Improving the claims handling practices in property insurance.
  • Modifying deadlines for notices of property insurance losses and limiting the assignment of benefits (AOB) under property insurance policies.
  • Updating property insurance requirements regarding alternative dispute processes, coverage options and agent practices.
  • Increasing oversight of property insurance market participants.
  • Improving the financial stability of Citizens Property Insurance Corporation – the Florida-owner “insurer of last resort”– reducing potential assessments related to the Citizens Property Insurance Corporation, and fostering the transition of Citizens Property Insurance Corporation policies to the private property insurance market.
  • Providing tax relief and other financial assistance related to damages resulting from Hurricanes Ian and Nicole.
  • Providing additional mechanisms to support the Division of Emergency Management for natural disaster response, recovery and relief efforts.
  • Establishing a statewide toll-credit program for frequent Florida commuters.

Detailed bills have not been released for the special session, which starts Monday.

During a news conference last month, Renner said lawmakers will look at a “kitchen sink of options” to try to stabilize the market and expand private coverage. But he also cautioned that whatever changes the Legislature makes during the special session will not lead to immediate rate reductions for consumers.

“As outlined in the proclamation, we will consider further reforms to ensure Floridians have access to reliable and affordable property insurance, legislation that provides property tax relief to Floridians whose homes are uninhabitable due to recent hurricanes, and legislation that establishes a statewide toll credit program for frequent Florida commuters,” Passidomo wrote Tuesday in a memo to senators. The toll-credit program is a priority of Gov. Ron DeSantis.

Private insurers have shed hundreds of thousands of policies and sought large rate increases during the past two years because of financial problems. Six insurers were declared insolvent this year.

Meanwhile, Citizens has seen its number of policies soar to more than 1.13 million as of Friday. State leaders have long sought to keep policies in the private market, at least in part because of financial risks to Citizens from major hurricanes.

Lawmakers held a special session in May to try to stabilize the market, but problems have persisted. Among the steps that lawmakers took during the May session was to provide $2 billion for reinsurance, which is essentially backup coverage that insurers need to handle large amounts of claims.

During the news conference last month, Renner indicated lawmakers could consider tapping state reserves to help with reinsurance. Renner, however, said he did not want to make a “long-term commitment to underwrite insurance.”

A day after Renner’s Nov. 22 news conference, Fitch Ratings released an analysis that said overall reinsurance prices are expected to increase by more than 10 percent in 2023, pointing to losses from disasters such as Hurricane Ian and “increasing frequency and severity of natural catastrophe claims.”

Fitch also said it expects tighter restrictions when reinsurance policies are renewed in 2023, while raising the possibility that Florida property insurers will not be able to buy all of the reinsurance they need.

“Nevertheless, we believe demand for property catastrophe reinsurance during the 2023 renewals season will be broadly met, except for Florida,” the analysis said.

Perhaps the noisiest issue of the special session will focus on limiting litigation costs and, particularly, whether to change a law that often leads to insurers paying the fees of plaintiffs’ attorneys. The insurance industry blames lawsuits for many of its problems, while plaintiffs’ attorneys argue litigation helps hold insurers accountable for properly paying customer claims.

A related issue is assignment of benefits, which is a practice that involves policyholders signing over claims to contractors, who then pursue payments from insurers. The industry argues that assignment of benefits leads to costly litigation.

© 2022 The News Service of Florida. All rights reserved.

Tuesday, December 6, 2022

What Could Make Home Prices Drop in 2023?

 Buyer demand has dropped due to rising rates, and seller supply slowed too, creating an uneasy balance. But if buyers drop or sellers expand more, it will impact prices.

NEW YORK – The U.S. housing market is in an uneasy state of equilibrium. Demand has plummeted as mortgage rates hit a two-decade high, but prices haven’t declined much in part because supply remains correspondingly low. If borrowing costs don’t start to normalize by early next year though, the scales may finally tip.

The start of the year, of course, is when homeowners and real estate agents start to bring new inventory to market. It’s a time-honored tradition that draws on some smart strategy and a bit of industry lore. As the thinking goes, buyers and sellers often want to get their transactions closed by summer, especially if they have children starting at new schools in September. Agents also contend that homes look their best in spring, surrounded by lush landscaping and emerald-green lawns. Even if sellers don’t come out in quite their usual numbers this year, there may still be enough additional inventory to push home prices down.

Clearly, the amount of supply on the market is still extraordinarily low relative to demand. It would take just 3.3 months to work through the market’s existing home inventory, based on non-seasonally adjusted data for the most recent month. The metric had already been declining consistently for a decade through 2019, but the pandemic brought it to unthinkable lows. It’s no wonder that the S&P CoreLogic Case-Shiller 20-City Composite Home Price Index is down only about 2% from its peak despite mortgage rates surging to 7% from 3% in 10 months.

But every year, the inventory-to-sales ratio spikes in January and February as transactions crater and the first new listings start to come online in anticipation of the spring open house season, which can set bad things in motion in times of stress. In January 2008, supply jumped by four months’ worth of housing to 15 months, and there was a similar spike during every January of the housing bust. The last two years have experienced unusually muted spikes in the ratio, but that won’t repeat again this winter. If you zoom in, it’s already clear that the number of months of supply has been climbing in a seasonally unusual manner. The trend line will start to look concerning if it breaks through seasonal norms from 2018 and 2019 in the months ahead.

Consider the various countervailing forces in the market heading into the 2023 inventory surge. On the one hand, some would-be sellers will decide to forgo transactions this year and hunker down in their existing homes, many financed with below-3% mortgages that they’d forfeit if they bought a new property. On the other hand, more than 30 million single-family homes and condominiums in the U.S. – 34% of the total – are mortgage free, according to data compiled by real estate analytics firm Attom. And many more homeowners simply won’t have the luxury of waiting for the next open house season to roll around. They include but are not limited to:

  • People with growing families who need to buy a bigger house
  • Seniors who need to move for health-related reasons
  • People required to move for work

On the latter point, housing bulls will often emphasize what they see as the cosmic shift that’s come from increased working from home. But that doesn’t imply that Americans will no longer move for their jobs. Hybrid work in knowledge-based industries certainly looks poised to endure, yet many companies no longer allow working full time from whatever palm-tree-lined destination their employees choose. As of June, only about 15% of full-time employees are fully remote, according to data from the Survey of Working Arrangements and Attitudes, an online survey of U.S. residents. That’s much higher than anyone ever imagined before the pandemic, but it still leaves 85% who may have to sell their homes if they get fired or leave their job for a new one in another part of the country.

All told, the early 2023 inventory spike looks unavoidable, and the real question is where mortgage rates will be when the listings hit the market. If inflation continues to moderate, that could lead financial markets to anticipate a change in monetary policy later next year. That would set the stage for Treasury bonds to rally and a corresponding drop in mortgage rates.

It’s a race against the clock, though, and you’d have to hope for a near-perfect run of inflation data to assuage jittery policymakers and financial market participants and bring 30-year mortgages back down below, say, 6%. Even then, it’s unlikely that rates will look anywhere near as attractive as the loans that prevailed for most of the past decade, and they might not be enough to keep the market’s delicate equilibrium intact and prices afloat.

© 2022 Bloomberg L.P.; © 2022 Penton Media. Based on research of Jose Maria Barrero of the Instituto Tecnologico Autonomo de Mexico; Nicholas Bloom of Stanford University; and Steven J. Davis of the University of Chicago’s Booth School of Business.

More Sellers Decide to Delist Their Homes

 By Kerry Smith

One agent’s take: “Some sellers are having a hard time grasping that we’re not in a housing-market frenzy anymore … that they missed the boat on getting a high price.”

SEATTLE – One out of every 50 housings listed for sales – a record 2% – were delisted each week on average during the 12 weeks ending Nov. 20 compared with 1.6% one year earlier, according to a report from Redfin. The share dropped to 1.9% for the 12 weeks ending Nov. 27, which includes the Thanksgiving holiday.

Sellers pull their listing for a variety of reasons, but many lately do so because they’re not getting the money they thought they would get as prices stagnate. Many sellers also don’t the challenges buyer have faced recently as higher mortgage rates cut into their homebuying dollar. While mortgage rates have dipped slightly since mid-November, the monthly mortgage payment on the median-asking-price home is still 40% higher than it was one year ago.

In some cases, sellers received no offers at the price they wanted, and in some cases no offers at all.

“Some sellers are having a hard time grasping that we’re not in a housing-market frenzy anymore – it’s tough for them to swallow that they missed the boat on getting a high price,” says Heather Kruayai, a Redfin real estate agent in Jacksonville. “By the time sellers realize their listing is priced too high, it has already been on the market for too long and is considered stale. I recently had two sellers take their homes off the market after 45-plus days.”

Florida metros – weekly delisting average – year-to-year change

  • Fort Lauderdale: 1.6%, up 0.2 points year-to-year
  • Jacksonville: 1.9% up 0.9 points
  • Miami: 1.9%, up 0.1 points
  • Orlando: 2.0%, up 0.4 points
  • Tampa: 1.9%, up 0.3 points
  • West Palm Beach: 1.7%, up 0.3 points

Nationally, only six metros saw a decrease in delistings year-to-year, all less than 1%: Warren, Michigan; Chicago; Newark, New Jersey; New Brunswick, New Jersey; Detroit; and Montgomery County, Pennsylvania.

West Coast tops for unhappy sellers

Sacramento, California, led the U.S. in the year-to-year increase of delisted homes – 3.6% of active listings were delisted per week, on average, during the 12 weeks ending Nov. 27, up 1.6 percentage points from one year earlier. It’s followed by Austin, TX (up 1.5 points), Seattle (up 1.4 points), Phoenix (up 1.3 points) and Denver (up 1.2 points).

Sacramento not only saw the biggest year-over-year jump in delistings; it also had the highest overall share, with 3.6% of for-sale homes delisted per week on average during the 12 weeks ending Nov. 27. It was followed by San Francisco (3.4%), Oakland (3.3%), Seattle (3.2%) and San Jose (3%).

Pittsburgh had the lowest share of delistings at 1.3%, followed by Cincinnati at 1.4%,New Brunswick (1.5%), Newark (1.6%) and Virginia Beach (1.6%).

“Usually, sellers who pull their listings off the market in the fall do it with the intention of listing again in the spring,” says David Palmer, a Redfin agent in Seattle. “But with the word ‘recession’ out there, there’s not as much optimism about spring being a better market. Now people are talking about trying again in another year or two once the economy improves.”

© 2022 Florida Realtors®

Friday, December 2, 2022

Florida Has 5 of Top 10 Move-To Metros in U.S.

 By Kerry Smith

Florida metros remain popular with outside-the-city homebuyers. In a 3Q top-state popularity contest, Fla. has 5 metros in the top 10 and Calif. has 2.

SEATTLE – About one in four (24.1%) U.S. homebuyers considered moving to a different metro area in third quarter of 2022, according to a report from Redfin, and five of the popular metros in the top 10 were in Florida.

Top U.S. metro areas by inflow in 3rd Quarter 2022

  1. Sacramento, California: Top origin metro, San Francisco. Top out-of-state origin: Chicago
  2. Las Vegas, Nevada: Top origin metro, Los Angeles. Top out-of-state origin: Los Angeles
  3. Miami: Top origin metro, New York. Top out-of-state origin: New York
  4. San Diego, California: Top origin metro, Los Angeles. Top out-of-state origin: Chicago
  5. Tampa: Top origin metro, New York. Top out-of-state origin: New York
  6. Phoenix, Arizona: Top origin metro, Los Angeles. Top out-of-state origin: Los Angeles
  7. Cape Coral, Florida: Top origin metro, Chicago. Top out-of-state origin: Chicago
  8. North Port-Sarasota, Florida: Top origin metro, Chicago. Top out-of-state origin: Chicago
  9. Dallas, Texas: Top origin metro, Los Angeles. Top out-of-state origin: Los Angeles
  10. Orlando, Florida: Top origin metro, New York. Top out-of-state origin: New York

The third quarter results were similar to the second quarter, according to the study, but up from 2019 when 18% of home shoppers searched for housing in a different metro area.

The U.S. housing market cooled significantly during the second half of 2022, but of the people still buying homes, an unprecedented portion are relocating to new metros. Many are seeking relative affordability as mortgage rates hover around 7% and persistently high home prices make expensive parts of the country even more expensive.

Overall, affordable Sun Belt metros are most popular with relocating homebuyers, largely because they can get more home for less money. In Las Vegas, for instance, the typical home cost $410,000 in October, roughly half the price of the typical home in Los Angeles ($823,000) – the most common origin for people moving there.

Buyers leaving expensive West Coast, East Coast cities

More homebuyers looked to leave San Francisco, Los Angeles, New York, Washington, D.C. and Boston than other major metros, determined by net outflow – a measure of how many more Redfin.com users looked to leave an area than move in.

In general, homebuyers are leaving expensive coastal job centers more than other places – a trend that started before the pandemic and picked up steam due to remote work and rising housing costs – and they commonly head to more affordable regions.

© 2022 Florida Realtors®

Fed Wants Home Prices to Fall – It’s Not a Side Effect

 By Meghan McCarty Carino

From the Federal Reserve’s perspective, they’re starting to win the fight against inflation if home prices are going down.

NEW YORK – The housing market has slowed way down, as expected, in response to rising interest rates. Home prices fell for the third straight month in September, according to the S&P CoreLogic Case-Shiller index. Its measure of national home prices dropped by 1% from the previous month, though values were still about 10% higher than a year earlier.

In case there was any lingering doubt, the new data shows the housing market has definitely turned, according to Mark Zandi, chief economist at Moody’s Analytics.

“It feels somewhat clifflike at the moment,” he said. “You know, I think what this reflects is whiplash. I mean, what goes up comes down.”

And down is the direction the Federal Reserve wants to see prices go as it tries to curb inflation, per Craig Lazzara, managing director at S&P Dow Jones Indices – which produces the Case-Shiller index.

“This is a feature, not a bug. This is what they want to see,” Lazzara said. “If I were [Fed Chair] Jay Powell, I would like it.”

Rising interest rates hit the housing market fast. According to Odeta Kushi, deputy chief economist at First American, the September index doesn’t even show the full extent.

“It’s mostly reflecting signed contracts in May through August, which is when the 30-year fixed-rate mortgage was in the low- to mid-5% range.”

Since then, 30-year fixed rates have topped 7% at times, which means prices likely have further to fall – especially in the most expensive markets. While prices dropped in all 20 cities tracked by the Case Shiller index, San Francisco, Seattle and other West Coast cities had some of the steepest declines, said Stuart Gabriel of the University of California, Los Angeles.

“We have very significant problems of affordability that relate to both high mortgage interest rates and high house prices,” he said. “That, of course, is prompting moves by households to more affordable areas.”

Copyright © Marketplace, 2022 APM. All rights reserved.

2023’s New Conventional Loan Limit: $726,200

 By Kerry Smith

FHFA announced new conforming loan limits for 2023, and most buyers can borrow up to $726,200 without a jumbo loan – and it’s over $1 Million in some areas.

WASHINGTON – Fannie Mae and Freddie Mac – which back a majority of U.S. home loans – have a new lending cap in 2023.

The Federal Housing Finance Agency (FHFA) announced that the conforming loan limit values (CLLs) for mortgages to be acquired by Fannie Mae and Freddie Mac (the Enterprises) in 2023 will go up $79,000 to $726,200 in most areas of the U.S for one-unit properties. The cap in those areas this year is $647,200.

The cap varies by county, however. FHFA says two U.S. counties will have a lower cap, and additional areas will have a higher cap that, in 2023, will rise about $1 million for the first time – up to $1,089,300 for one-unit properties. FHFA says about 3.3% of counties – 100 out of more than 3,000 – are considered high-cost markets.

In Florida, the higher conforming cap largely applies only for some Monroe County residents.

The higher cap applies in areas where 115% of the local median-home value exceeds the baseline conforming loan limit. The Housing and Economic Recovery Act (HERA) of 2008 includes a calculation to create a higher cap in those areas. In addition, special statutory provisions create different loan limits for Alaska, Hawaii, Guam and the U.S. Virgin Islands. In these areas, the baseline loan limit will also be $1,089,300 for one-unit properties.

HERA is a yearly adjustment to conforming loan limits. According to the nominal, seasonally adjusted, expanded-data FHFA HPI, house prices increased 12.21%, on average, between the third quarters of 2021 and 2022. As a result, 2023’s baseline conforming loan limit will increase by the same percentage.​

Other resources

© 2022 Florida Realtors®

Wednesday, November 30, 2022

Housing Prices Up by Year, Down by Month

 By Kerry Smith

Sept.’s S&P CoreLogic Case-Shiller 20-city price index found a year-to-year increase of 10.4%, but Miami (up 24.6%) and Tampa (up 23.8%) led the nation.

NEW YORK – Dinged by rapidly increasing mortgage rates, home prices continue to show strong growth year-to-year but declines in month-to-month comparisons. In the S&P CoreLogic Case-Shiller Indices (S&P DJI) for September, home price gains declined across the United States.

Year-over-year

The Index covers nine U.S. census divisions, and overall reported a 10.6% year-to-year gain in September, a decline from the 12.9% reported in August. The Index’s 10-City Composite came in at 9.7%, down from 12.1% in the previous month; its 20-City Composite posted 10.4% year-over-year, down from 13.1% the previous month.

However, slowing price increases aren’t as notable in Florida, and two of the nine areas tracked in the U.S., the South and the Southeast, continued to outpace the rest of the nation.

MiamiTampa and Charlotte reported the highest year-over-year gains among the 20 cities in September. Miami led the way with a 24.6% year-over-year price increase, followed by Tampa in second with a 23.8% increase. Charlotte came in a somewhat distant third with a 17.8% increase.

Still, all 20 cities – including Miami and Tampa – reported lower price increases in September 2022 than they did in August.

“As the Federal Reserve continues to move interest rates higher, mortgage financing continues to be more expensive and housing becomes less affordable. Given the continuing prospects for a challenging macroeconomic environment, home prices may well continue to weaken,” says Craig J. Lazzara, managing director at S&P DJI.

Month-over-month

Before seasonal adjustment, the U.S. National Index posted a -1.0% month-over-month decrease in September, while the 10-City and 20-City Composites posted decreases of -1.4% and -1.5%, respectively.

After seasonal adjustment, the U.S. National Index posted a month-over-month decrease of -0.8%, and the 10-City and 20-City Composites both posted decreases of -1.2%.

In September, all 20 cities reported declines before and after seasonal adjustments.

“As has been the case for the past several months, our September 2022 report reflects short -term declines and medium-term deceleration in housing prices across the U.S.,” says Lazzara. “For all three composites, year-over-year gains, while still well above their historical medians, peaked roughly six months ago and have decelerated since then.

“The three best-performing cities in August repeated their performance in September. On a year-over- year basis, Miami (+24.6%) edged Tampa (+23.8%) for the top spot, with Charlotte (+17.8%) beating Atlanta (+17.1%) for third place. The Southeast (+20.8%) and South (+19.9%) were the strongest regions by far, with gains more than double those of the Northeast, Midwest, and West.”

© 2022 Florida Realtors®