South Florida Inventory Search

South Florida Inventory Search
Click to Search the Complete South Florida Property Inventory

Thursday, January 26, 2023

U.S. Pending Home Sales Rise For First Time In 14 Months

  by  and  - Redfin News

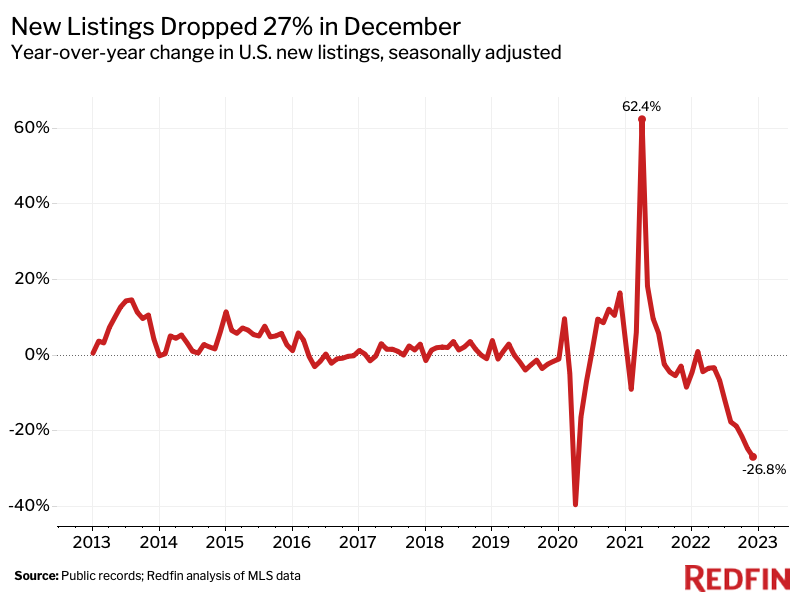
Pending sales increased 3% in December from the month before, the first monthly gain since October 2021. But sellers remained on the sidelines, with new listings posting their biggest annual drop since the start of the pandemic. 

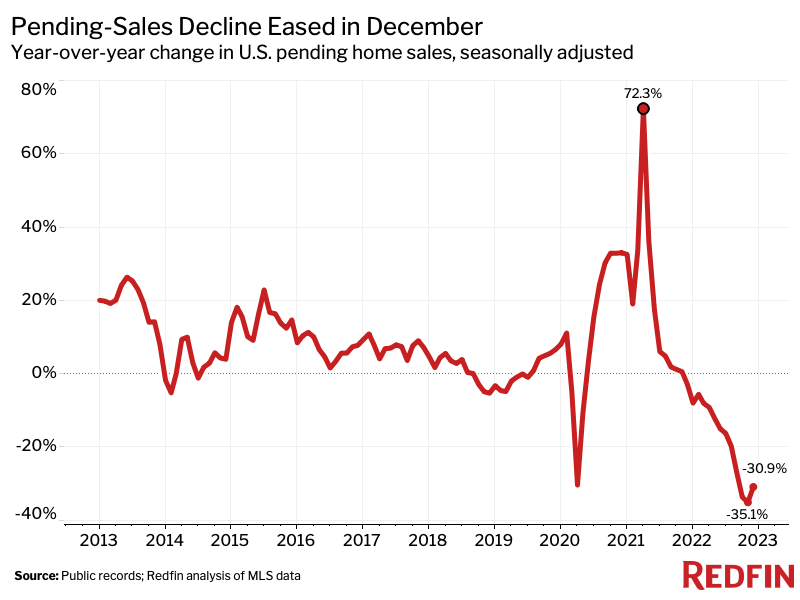
Seasonally adjusted pending home sales rose 2.9% nationwide in December, the first month-over-month increase since October 2021. Pending sales continued falling year over year, but the decline eased for the first time in 10 months—to 30.9% from a record 35.1% drop in November. 

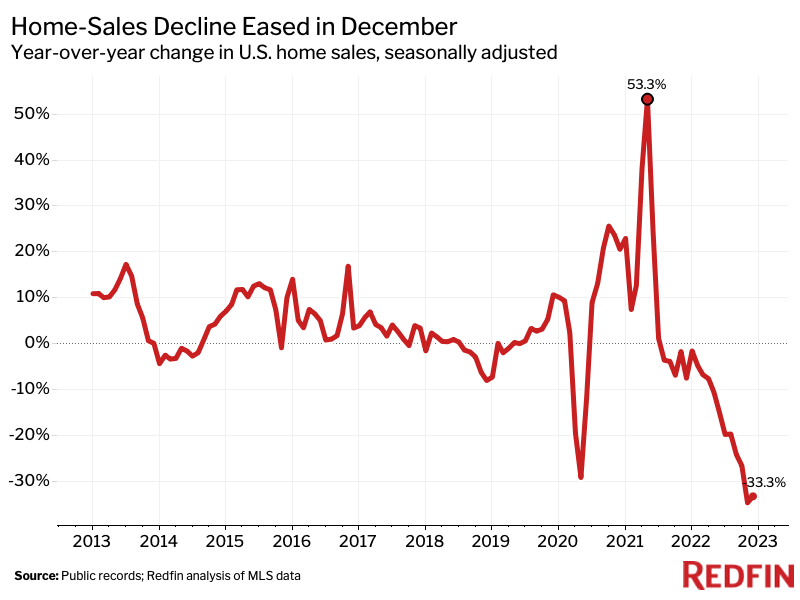
Closed home sales fell 33% from a year earlier, but that drop also eased from a record 35% decline in November. Still, far fewer homes are selling now than a year ago during the pandemic homebuying frenzy. 

“The small uptick in pending sales suggests some homebuyers returned to the market at the tail end of 2022 after demand plummeted in the fall,” said Redfin Economics Research Lead Chen Zhao. “That’s mostly because slowing inflation has driven mortgage rates down to about 6% from a peak of over 7%, giving buyers some relief and sending the typical buyer’s payment down nearly $200.  Along with the dollar decline in monthly payments, rates traveling down instead of up are helping some sidelined buyers get back into a house-hunting mindset.”

Some Redfin agents in certain areas have noticed homebuyer activity pick up since it stagnated in the fall. In Los Angeles, for instance, local agent Lindsay Katz has seen small bidding wars on fairly priced, move-in ready homes in desirable neighborhoods over the last few weeks, with the stabilization of mortgage rates giving buyers more confidence. But she said the lack of new listings means prospective buyers don’t have many options. 

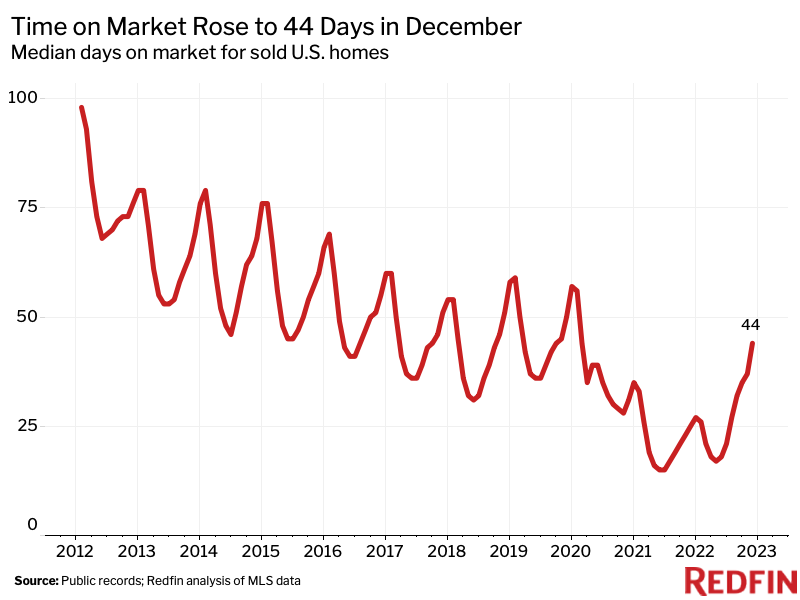
New listings fell 26.8% year over year in December, the most since the onset of the pandemic, with many homeowners keen to hold onto their low mortgage rates and/or reluctant to sell in a still-slow market. The typical home that sold was on the market for 44 days—nearly twice as long as a year earlier. Data from early January, however, suggests that some homeowners are noticing the uptick in buyer interest and warming up to listing their home for sale.

December Highlights

December 2022Month-Over-Month ChangeYear-Over-Year Change
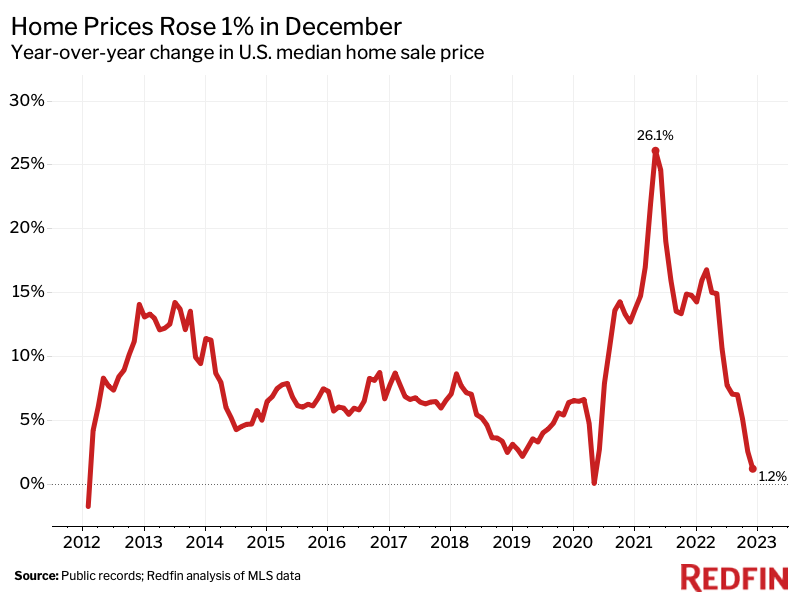
Median sale price$388,100-1.4%1.2%
Pending home sales, seasonally adjusted405,0072.9%-30.9%
Homes sold, seasonally adjusted402,908-4.4%-33.3%
New listings, seasonally adjusted474,257-3.1%-26.8%
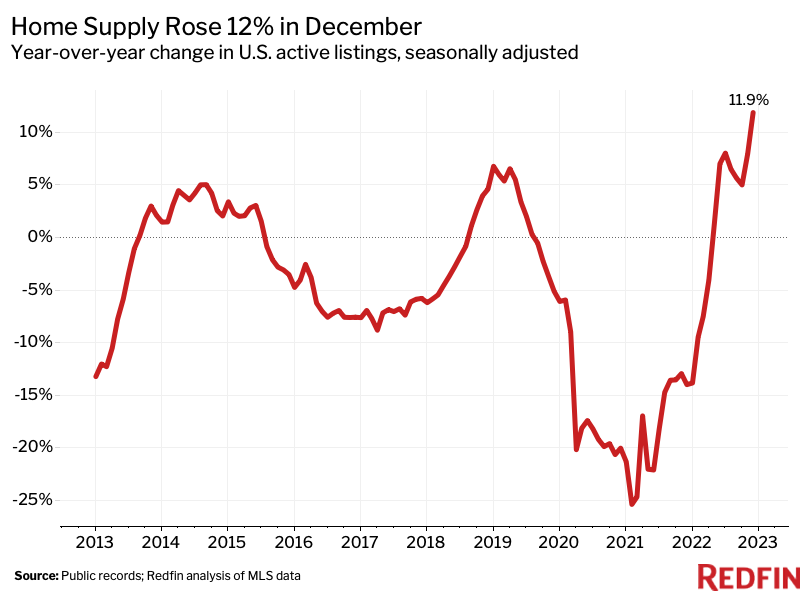
All homes for sale, seasonally adjusted1,590,8541.6%11.9%
Months of supply2.3-0.41.3
Median days on market44619
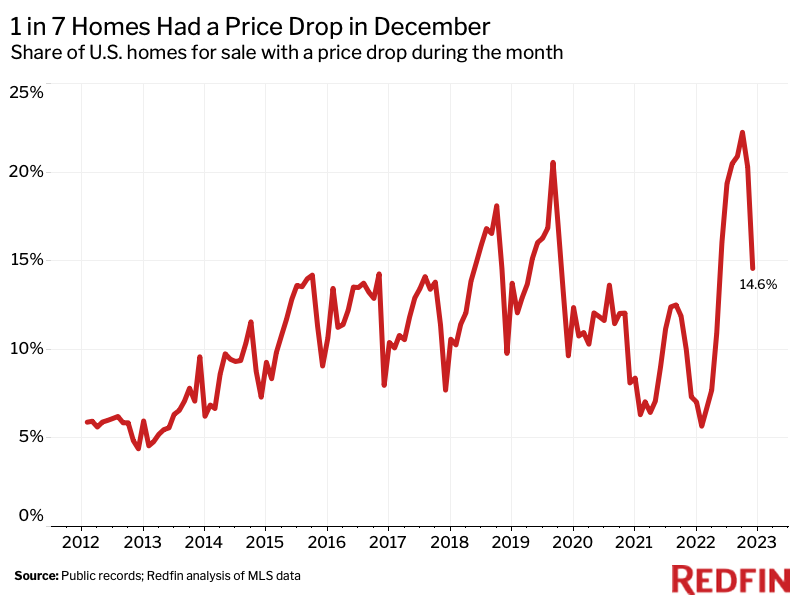
Share of for-sale homes with a price drop14.6%-5.7 ppts7.2 ppts
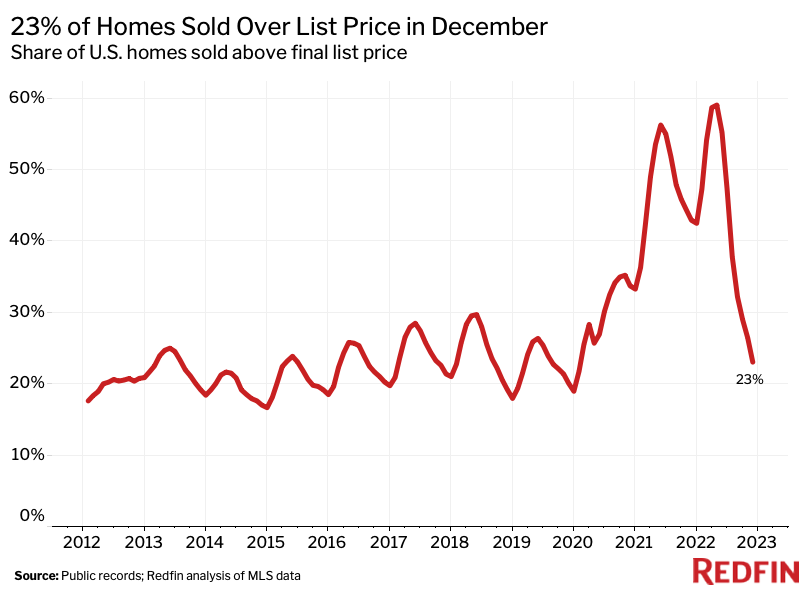
Share of homes sold above final list price23%-3.4 ppts-19.9 ppts
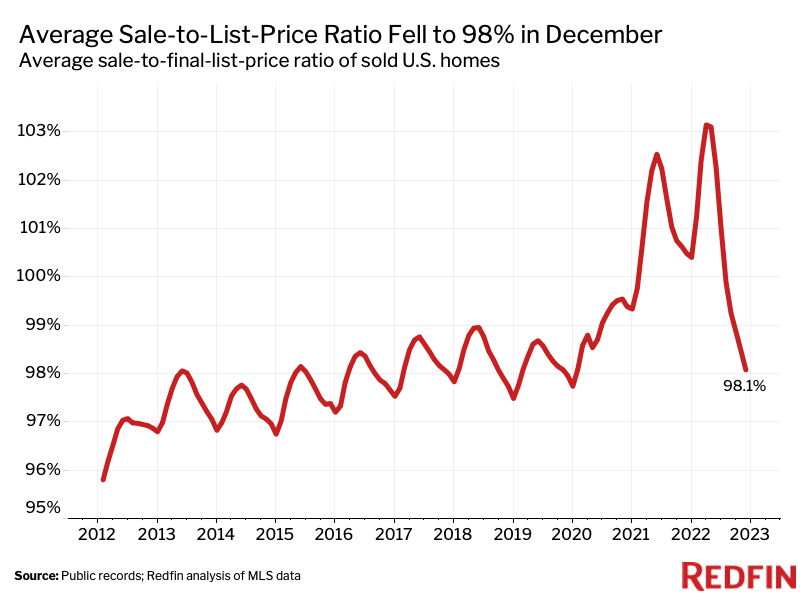
Average sale-to-final-list-price ratio98.1%-0.4 ppts-2.4 ppts
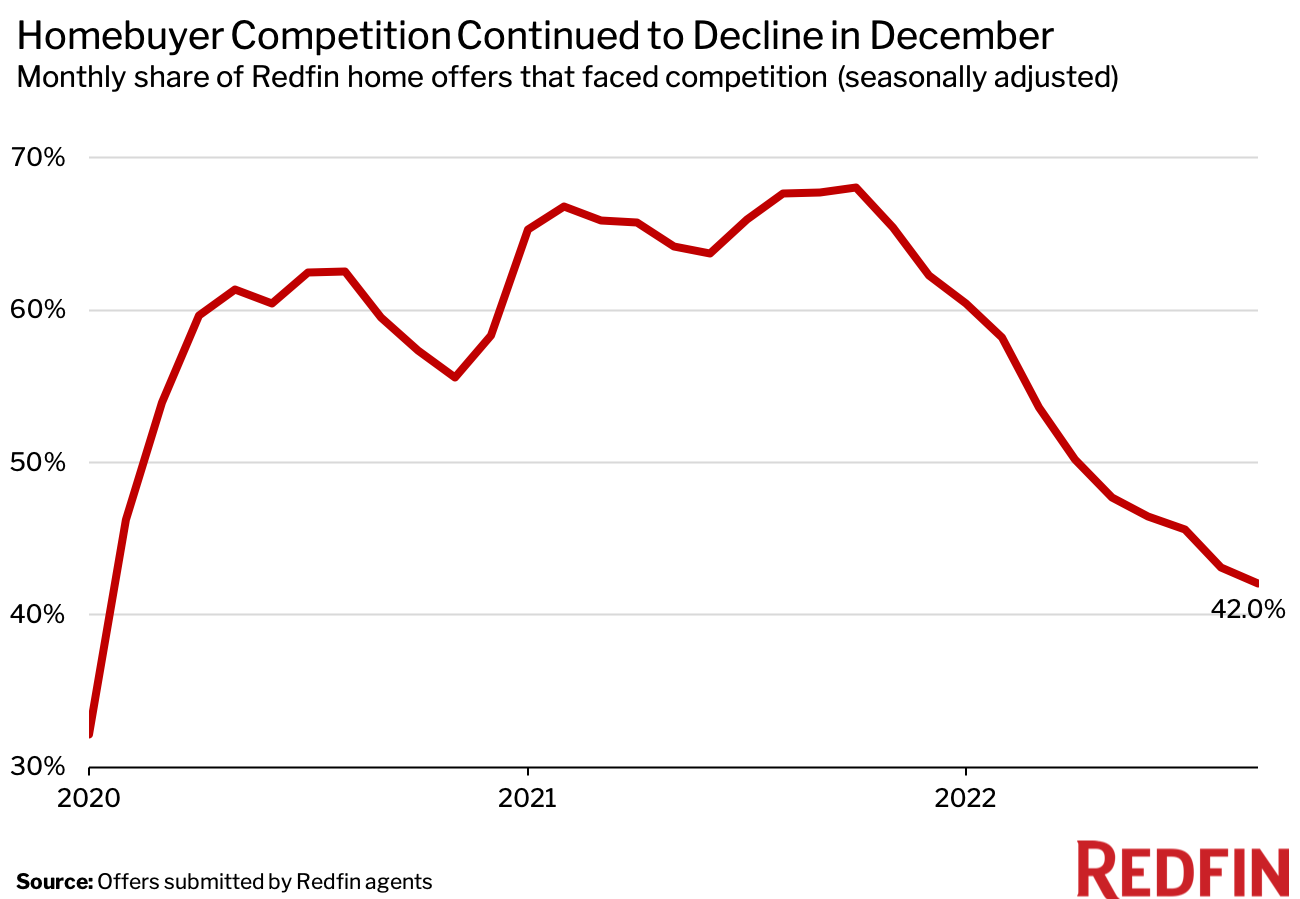
Share of home offers written by Redfin agents that faced competition, seasonally adjusted42%-1.1 ppts-25.7 ppts
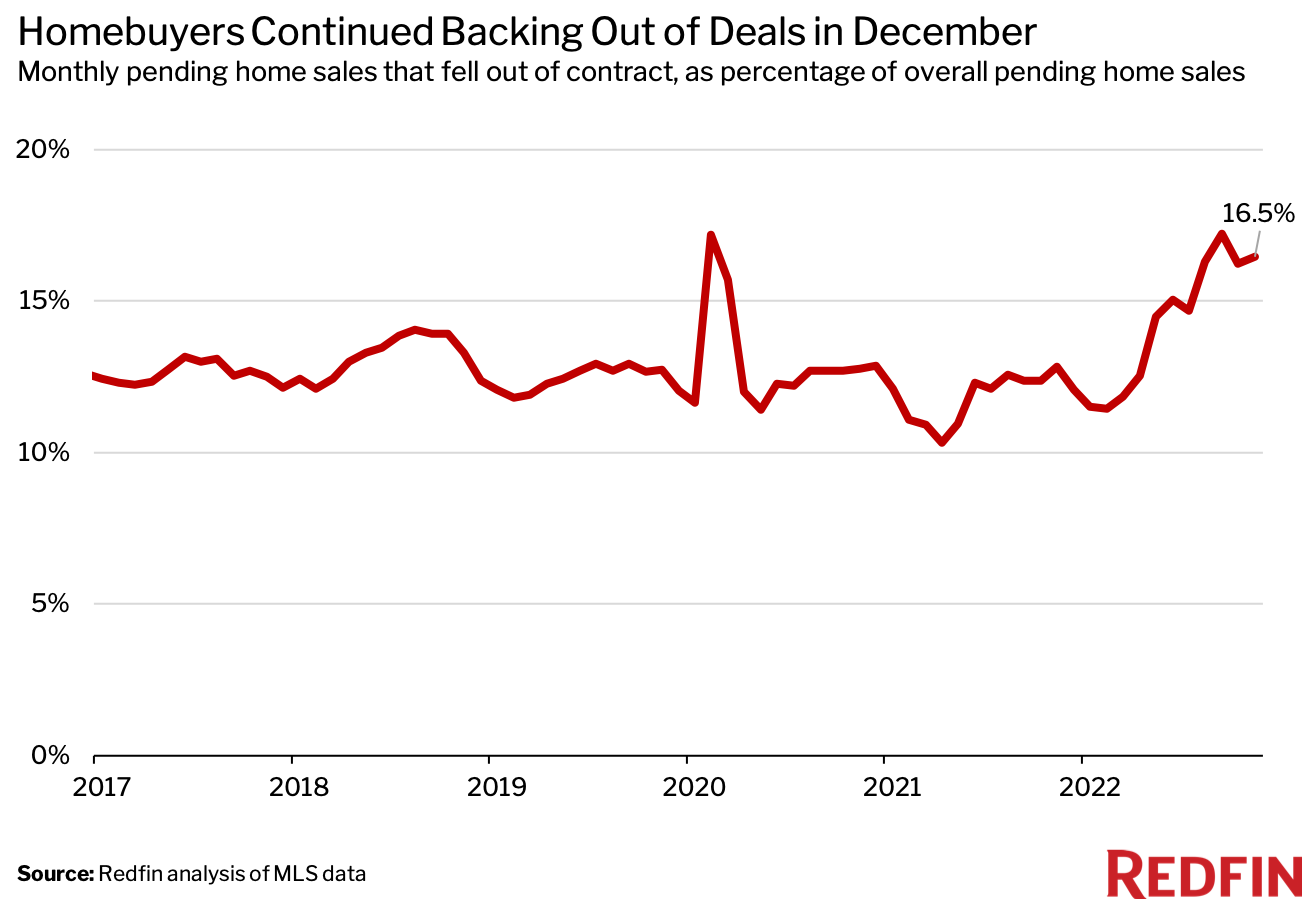
Pending sales that fell out of contract, as % of overall pending sales16.5%0.2 ppts3.6 ppts
Average 30-year fixed mortgage rate6.36%-0.45 ppts3.26 ppts

Note: Data is subject to revision

Metro-Level Highlights: December 2022

Data in the bullets below came from a list of the 90 U.S. metro areas with populations of at least 750,000, unless otherwise noted. To find the full metro-level and national datasets, head to the monthly section of the Redfin Data CenterRefer to our metrics definition page for explanations of metrics used in this report. Metro-level data is not seasonally adjusted, unless otherwise noted.

  • Home sales: In San Jose, pending sales rose 21% month over month on a seasonally adjusted basis—more than any other metro. Next came Anaheim (15.8%), Richmond, VA (15.5%), Albany, NY (13.1%) and Chicago (11.6%). On a year-over-year, unadjusted basis, only one metro saw an increase in pending sales: San Francisco (2.4%). The biggest decliners were Boise, ID (-77.5%), Baton Rouge, LA (-65.5%) and New Orleans (-52.8%).
  • Prices: Median sale prices fell from a year earlier in 26 metros, led by San Francisco (-11.4%). Next came San Jose (-7.6%), Memphis, TN (-6.5%), Honolulu (-5.6%) and Detroit (-5.5%). The biggest increases were in Greensboro, NC (15.2%), El Paso, TX (12.9%), Rochester, NY (12.2%), Omaha, NE (10.4%) and Nashville, TN (9.9%).
  • Listings: New listings fell the most from a year earlier in Boise (-57.4%), Greensboro (-52.2%), Tacoma, WA (-48.5%), Seattle (-48.2%) and Stockton, CA (-47.5%). They fell the least in McAllen, TX (-3.5%), Detroit (-7.6%), Albany, NY (-11%), North Port, FL (-11.8%) and Rochester (-13.9%).
  • Supply: Active listings rose the most from a year earlier in North Port (79.5%), Seattle (59.5%), Nashville (56.5%), Tampa, FL (55.8%) and Fort Worth, TX (48.1%). They fell the most in Greensboro (-28.4%), Milwaukee (-28.4%), Hartford, CT (-28.4%), Bridgeport, CT (-26.3%) and New Haven, CT( -18%).

Scroll down for market-by-market breakdowns on competition and home-purchase cancellations, which aren’t in the Data Center.
 

Competition

Data below came from a list of 34 metros that had a monthly average of at least 50 offers submitted by Redfin agents from March 2021 to March 2022. An offer is considered part of a bidding war if a Redfin agent reported that it received at least one competing bid. The table is ranked from lowest December 2022 competition rate to highest. 

Metro AreaDec. 2022: Share of Redfin Offers That Faced CompetitionNov. 2022: Share of Redfin Offers That Faced CompetitionDec. 2021: Share of Redfin Offers That Faced Competition
Austin, TX 13.9%32.1%57.2%
Orlando, FL 20.0%8.1%55.0%
San Antonio, TX 20.0%33.3%53.0%
Phoenix, AZ 21.3%17.8%48.2%
Miami, FL 21.7%27.7%48.6%
Las Vegas, NV 22.7%24.6%48.0%
Nashville, TN 22.7%22.2%52.6%
Dallas, TX 23.7%31.7%65.9%
Raleigh, NC 23.8%28.6%63.3%
Seattle, WA 24.2%25.3%70.6%
Tampa, FL 26.3%16.7%66.7%
Riverside, CA 26.4%25.0%46.7%
Portland, OR26.6%36.9%64.4%
Houston, TX 29.6%22.3%45.2%
Sacramento, CA 31.7%45.5%67.1%
Colorado Springs, CO 35.7%41.7%62.9%
Denver, CO 36.0%29.0%65.1%
Philadelphia, PA37.4%46.9%59.9%
Honolulu,HI38.5%14.3%72.1%
Chicago, IL39.9%38.7%47.9%
Charlotte, NC40.0%31.4%52.5%
San Francisco, CA 40.4%50.7%68.1%
Washington, D.C.40.5%44.5%60.5%
New York, NY41.0%57.7%62.7%
Atlanta, GA 42.3%41.9%61.9%
Los Angeles, CA 44.9%48.4%72.6%
San Diego, CA 48.1%43.5%72.5%
Boston, MA48.3%43.9%68.4%
Detroit, MI 50.0%32.1%46.9%
Baltimore, MD 50.9%48.6%64.3%
Worcester, MA52.4%55.6%59.4%
San Jose, CA 57.6%60.5%75.3%
Minneapolis, MN57.9%42.9%54.2%
Providence, RI63.2%62.5%57.1%
National—U.S.A. (seasonally adjusted)42%43.1%67.7%

Note: Metro-level competition data is not seasonally adjusted.

Home-Purchase Cancellations

Data below came from a list of the 50 most populous metro areas and is ranked from highest percentage of cancellations in December 2022 to lowest. 

Metro AreaDec. 2022: Pending Sales That Fell Out of Contract, as % of Overall Pending SalesNov. 2022: Pending Sales That Fell Out of Contract, as % of Overall Pending SalesDec. 2021: Pending Sales That Fell Out of Contract, as % of Overall Pending Sales
Jacksonville, FL 25.6%25.2%19.2%
Atlanta, GA 23.4%23.1%7.8%
Fort Lauderdale, FL 21.1%21.4%20.2%
Tampa, FL 20.7%22.1%21.2%
Houston, TX 20.7%21.0%19.9%
Cleveland, OH 20.6%19.2%20.6%
Fort Worth, TX 20.3%20.3%17.4%
Dallas, TX 20.0%21.9%17.5%
Riverside, CA 19.6%19.2%17.0%
Orlando, FL 19.5%22.4%21.4%
Denver, CO 19.3%18.3%7.4%
Phoenix, AZ 19.0%18.7%17.2%
Chicago, IL 18.8%17.8%16.6%
Miami, FL 18.6%18.3%15.6%
Las Vegas, NV 18.6%20.8%21.4%
West Palm Beach, FL 18.4%17.6%18.5%
Detroit, MI 17.9%16.1%15.7%
Indianapolis, IN 17.3%18.8%16.4%
Pittsburgh, PA 17.2%17.7%17.1%
Columbus, OH 17.2%18.4%15.8%
Sacramento, CA 17.2%17.5%14.2%
St. Louis, MO 17.1%15.6%15.6%
Austin, TX 16.1%17.3%12.8%
Portland, OR 15.9%16.8%14.5%
Nashville, TN 15.9%16.3%15.6%
Virginia Beach, VA 15.8%14.6%15.3%
Anaheim, CA 15.8%14.4%11.9%
Washington, DC 15.4%13.6%12.3%
San Antonio, TX 15.0%12.6%19.9%
Kansas City, MO 15.0%17.2%16.3%
Baltimore, MD 14.9%13.3%14.1%
Los Angeles, CA 14.8%17.7%13.7%
Cincinnati, OH 14.2%15.6%16.1%
Providence, RI 14.1%12.2%13.1%
Charlotte, NC 14.0%14.8%12.0%
New Brunswick, NJ 13.7%13.2%8.9%
San Diego, CA 13.6%16.5%13.5%
Philadelphia, PA 13.5%14.7%12.0%
Warren, MI 13.2%13.3%11.0%
Seattle, WA 12.6%12.4%7.8%
Milwaukee, WI 12.1%11.3%11.2%
Boston, MA 12.0%11.8%10.9%
Oakland, CA 11.7%8.7%6.7%
Newark, NJ 11.5%12.4%1.7%
Montgomery County, PA 10.9%9.5%11.2%
Minneapolis, MN 10.2%11.9%10.2%
New York, NY 9.4%8.4%5.2%
San Jose, CA 7.5%8.6%5.2%
Nassau County, NY 5.7%7.2%4.4%
San Francisco, CA 4.1%6.3%2.6%
National—U.S.A.16.5%16.2%12.8%


Dana Anderson

As a data journalist at Redfin, Dana Anderson writes about the numbers behind real estate trends. Redfin is a full-service real estate brokerage that uses modern technology to make clients smarter and faster. For more information about working with a Redfin real estate agent to buy or sell a home, visit our Why Redfin page.

 Email Dana

Lily Katz

As a data journalist, Lily is passionate about helping readers understand complex facets of the housing market. She is particularly interested in the issues of climate change, race and gender equality and housing affordability. Prior to working at Redfin, Lily spent four years as a reporter at Bloomberg News in New York City.

 Email Lily

More than 2 million U.S. homes no longer require a jumbo loan

 By Kerry Smith

SEATTLE – More than 2 million U.S. homes no longer require a jumbo loan, according to a new analysis by Zillow Home Loans. That means some buyers will have additional for-sale inventory to consider if they need financing. The study estimates that an additional 2 million U.S. homes now qualify for a conventional mortgage.

The change is due to the Federal Housing Finance Agency’s (FHFA) recent increase of conforming loan limits to $1,089,300 in some high-cost markets. Loans above the cap won’t be considered by mortgage-bakers Fannie Mae and Freddie Mac and, as a result, are called jumbo loans.

Compared to conforming loans, jumbo loans typically require a higher credit score – 700 is the minimum that many lenders accept for a jumbo loan, versus 620 which many require for a conforming loan. Jumbo loans also often require 20% down, although some call for even higher down payments. Some jumbo loans also will require proof of larger cash reserves than conventional loans (up to 12 months’ worth).

For most of the country, the conforming loan requirement increased by $79,000 – going from $647,200 in 2022 to a baseline of $726,200 in 2023. In the most expensive parts of the county (103 counties), the conforming loan limit was raised to $1,089,300, topping the $1 million mark for the first time. These counties are largely concentrated in the nation’s most expensive metro areas, along the coasts, and in the Mountain West.

“The addition of 2 million homes that now qualify for conforming loan options across the county is welcome news for homebuyers entering a shopping season with fewer homes on the market,” says Nicole Bachaud, Zillow Home Loans senior economist. “Home price appreciation has slowed significantly, and this means that homes nearing jumbo loan territory will stay eligible for conforming loans longer than we have seen in the last few years.”

© 2023 Florida Realtors®

Monday, January 23, 2023

Interest Rates, Price Inflation Impact Florida’s 2022 Housing Market

 ORLANDO, Fla. – As 2022 ended, Florida’s housing market looked similar to the more traditional market years prior to the pandemic in terms of total closed sales, though it fell short in the year-to-year compared to the unusually strong 2021 sales. The statewide inventory of for-sale existing homes and condo properties showed gains while statewide median sales prices continued to rise year-over-year, despite headwinds from inflation and higher interest rates, according to the latest housing data released by Florida Realtors®.

Year End 2022

Florida Realtors® Chief Economist Dr. Brad O’Connor pointed out that in 2021, Florida’s housing market was “on a sugar high. Overall, closed sales in 2022 were pretty good when you look at the more ‘traditional’ housing market years of 2018 and 2019.”

At the end of 2022, statewide closed sales of existing single-family homes totaled 287,352, down 18% compared to the 2021 year-end level, according to data from Florida Realtors’ research department in partnership with local Realtor boards/associations. Closed sales may occur from 30- to 90-plus days after sales contracts are written.

The statewide median sales price for single-family existing homes at year’s end was $402,500, up 15.7% from the previous yearThe median is the midpoint; half the homes sold for more, half for less.

Looking at Florida’s year-to-year comparison for sales of condo-townhouses, a total of 125,494 units sold statewide in 2022, down 21.7% compared to 2021. The statewide median price for condo-townhouse properties at the end of the year was $306,500, up 21.6% from the previous year.

Statewide, the median percentage of the original listing price received by sellers at the end of 2022 continued at about the same level year-over-year in both property type categories at 100% for single-family existing homes and at 99.9% for condo and townhouse units.

According to Florida Realtors’ data, at the end of 2022, in December 2022 and also in 4Q 2022, inventory (active listings) for single-family homes stood at a 2.7-months’ supply, while inventory for condo-townhouse properties was at a 2.8-months’ supply.

“The good news is, we have a lot more inventory than what we had over the pandemic years,” O’Connor said. “Active listings of single-family existing homes more than doubled from a 1-month supply at the end of 2021 to a 2.7-months’ supply at the end of 2022. If we get a little relief in mortgage rates, then all the other factors are still there that make Florida appealing and a strong draw for buyer demand.”

December 2022

In December, closed sales of single-family homes statewide totaled 19,158, down 36.1% from December 2021, while existing condo-townhouse sales totaled 7,677, down 40% year-over-year, according to Florida Realtors’ data.

The statewide median sales prices for both existing single-family homes and condo-townhouse properties rose year-over-year in December 2022. The statewide median sales price for single-family existing homes was $395,000, up 5.6% from the previous year. Meanwhile, the statewide median price for condo-townhouse units was $310,000, up 8.8% over the year-ago figure.

4Q 2022

Statewide closed sales of existing single-family homes totaled 57,004 in the fourth quarter of 2022, down 33.1% compared to the previous-year figure, according to Florida Realtors’ data. The statewide median sales price for existing single-family homes for 4Q 2022 was $400,000, up 9.6% from 4Q 2021.

Looking at Florida’s year-to-year comparison for sales of condo-townhouses in 4Q 2022, a total of 23,117 units sold statewide, down 35.5% from the same quarter in 2021. The statewide median price for condo-townhouse properties for the quarter was $310,000, up 14% over the previous year.

Looking ahead in 2023, Chief Economist O’Connor said mortgage rates – and the Federal Reserve’s action on interest rates as it continues to fight inflation – will influence ongoing market conditions.

He said, “Over the next six months, if mortgage rates don’t rise and return to 7%, that would help encourage buyers – and I think we’ll see mortgage rates stay just above 6% for a while. If we keep seeing more good news on the economic front, then I think we’ll see the housing market respond. Buyer demand is there, perhaps waiting on easing home prices, more supply and other factors.”

To see the full statewide housing activity reports, go to the Florida Realtors’ Newsroom and look under Latest Releases or download the December, 4Q or Year End 2022 data report PDFs under Market Data on the site.

© 2023 Florida Realtors®

Tuesday, January 17, 2023

Short-Term Rentals Hurting South Florida Residents

 By Rebecca San Juan

South Florida's demand for short-term rentals entices more real estate investors to offer them, but, according to an FAU report, that helped pushed rents higher for year-round residents.

MIAMI – South Florida renters can partly blame high home rents on the popularity of short-term rentals in the region, according to a new report from a Florida Atlantic University (FAU) housing expert.

Apartments, townhouses, condominiums and single-family houses rented for less than six months reduce housing inventory for locals looking to rent for a year or more in Miami-Dade, Broward and Palm Beach counties, according to the latest monthly rent index by Ken H. Johnson, a finance professor at FAU specializing in real estate. Johnson based his conclusion on anecdotal evidence from conversations with about 200 real estate agents, tenants and developers in 2022, plus rental data from Zillow, a national online real-estate marketplace.

What’s the solution then in one of the country’s top markets for arranging short-term rentals via Airbnb and Vrbo digital platforms, and one where property owners earn the most money by consistently using those platforms to rent their condos and apartments for weekend, weekly or monthly stays?

Miami is one of the most expensive Airbnb markets in the world: The average monthly price of a short-term rental in the city is $8,024, according to a study released in March 2022 by Compare the Market, making it the third most profitable Airbnb market globally for hosts, after Las Vegas and Honolulu. In 2021, Miami Airbnbs hosted 710,000 guests and earned a collective $200 million for the hosts, Airbnb said at the time.

An Airbnb North American spokesperson told the Miami Herald last March the company has seen bookings for long-term stays of 28 days or more via the online platform skyrocket in cities like Miami since the pandemic emerged. The spokesperson attributed Miami’s allure to year-round sunshine, bevy of outdoor activities and lax COVID-19 rules that drove remote workers here to live and work.

Johnson said homeowners should opt for seeking long-term lease deals for the sake of the regional housing market and their individual bottom lines. In this economy where more renters this year are expected to opt for roommates or move back home with parents because they can’t afford rental costs by themselves, Johnson said, landlords would have less risk with a single steady renter for a year or more.

“With a looming recession,” Johnson said, “demand might not be what it used to be (for short-term rentals), but there will be demand for long-term rentals. The potential (economic) instability is encouraging us to go away from short-term rentals, because less people will be working remotely and taking a vacation.”

For their part, officials at Airbnb and Vrbo declined multiple requests from the Herald to comment or provide information for this story.

Miami Beach does not allow for Airbnbs in most residential areas and used to have some of the steepest fines in the country for illegal Airbnbs, with perpetrators facing between $20,000 and $100,000 fines. The city sharply reduced those fines after Airbnb sued in 2018.

Johnson’s finding aligns with some national studies, said Dr. Tingyu Zhou, Dean Gatzlaff Associate Professor of Real Estate in Florida State University’s real estate department. Zhou said policymakers can step in by levying taxes on those who rent their homes for less than a year.

The pace of rent increases is expected to slow in Miami-Dade County. It’s welcome news to renters living in the ‘most competitive’ rental market in the country in 2022, according to a recent survey by RentCafe. Still, home rents are unaffordable for many South Florida households without becoming cost burdened, meaning they are forced to spend more than a third of their monthly income on housing.

Through the ongoing pandemic that began in March 2020, rent increases in Miami-Dade forced out many essential workers who could no longer afford to live here. Miami-Dade County responded last spring by declaring a state of emergency due to housing, and county Mayor Daniella Levine Cava led county officials in allocating tens of millions of dollars for rental assistance for households most in need.

Local policymakers, real estate experts and developers continue discussing potential long-term solutions for Miami-Dade’s housing affordability crunch. All agree more supply is needed in the community, especially affordable and workforce housing.

© 2023 Miami Herald. Distributed by Tribune Content Agency, LLC.