South Florida Inventory Search

South Florida Inventory Search
Click to Search the Complete South Florida Property Inventory

Friday, August 30, 2024

U.S. Foreclosure Activity in July Up 15% From June but Similar to a Year ago

 Florida was 2nd in states with most foreclosure starts, Miami was one of the major metros with most foreclosure starts and Jacksonville was for highest foreclosure rates.

IRVINE, Calif. – ATTOM has released its July 2024 U.S. Foreclosure Market Report, which shows there were a total of 31,929 U.S. properties with foreclosure filings default notices, scheduled auctions or bank repossessions – up 15% from a month ago and up slightly by 0.2% from a year ago.

“July’s foreclosure activity reflects a slight shift in the housing market,” said Rob Barber, CEO at ATTOM. “With an 18% increase in foreclosure starts and a 14% rise in completed foreclosures from last month, these shifts may highlight growing pressures in certain areas.

However soaring home prices seem to continue and have spiked the value of homes across the nation, which boosts equity for homeowners at virtually every stage of paying off mortgages. Monitoring these next few months will help us better understand the implications for the real estate sector.”

Delaware, Nevada, and Utah post highest foreclosure rates

Nationwide, one in every 4,414 housing units had a foreclosure filing in July 2024. States with the highest foreclosure rates were Delaware (one in every 2,214 housing units with a foreclosure filing); Nevada (one in every 2,245 housing units); Utah (one in every 2,289 housing units); New Jersey (one in every 2,607 housing units); and Illinois (one in every 2,660 housing units).

Among the 224 metropolitan statistical areas with a population of at least 200,000, those with the highest foreclosure rates in July 2024 were Provo-Orem, UT (one in every 940 housing units with a foreclosure filing); Macon, GA (one in every 1,167 housing units); Columbia, SC (one in every 1,587 housing units); Spartanburg, SC (one in every 1,895 housing units); and Atlantic City-Hammonton, NJ (one in every 1,910 housing units).

Those metropolitan areas with a population greater than 1 million with the worst foreclosure rates in July 20244 were: Las Vegas, NV (one in every 2,089 housing units); Philadelphia, PA (one in every 2,197 housing units); Jacksonville, FL (one in every 2,274 housing units); Chicago, IL (one in every 2,279 housing units); and Riverside, CA (one in every 2,556 housing units).

Greatest numbers of foreclosure starts in California, Florida, and Texas

Lenders started the foreclosure process on 21,870 U.S. properties in July 2024, up 18% from last month and up 4% from a year ago.

States that had the greatest number of foreclosure starts in July 2024 included: California (2,342 foreclosure starts); Florida (2,339 foreclosure starts); Texas (2,222 foreclosure starts); Illinois (1,221 foreclosure starts); and New York (1,145 foreclosure starts).

Those major metropolitan areas with a population greater than 1 million that had the greatest number of foreclosure starts in July 2024 included: New York, NY (1,286 foreclosure starts); Chicago, IL (1,555 foreclosure starts); Philadelphia, PA (782 foreclosure starts); Miami, FL (758 foreclosure starts); and Los Angeles, CA (689 foreclosure starts).

Foreclosure completion numbers increase from last month

Lenders repossessed 3,282 U.S. properties through completed foreclosures (REOs) in July 2024, up 14% from last month and down 2% from last year.

States that had the greatest number of REOs in July 2024, included: New York (377 REOs); California (370 REOs); Illinois (221 REOs); Pennsylvania (219 REOs); and Michigan (212 REOs).

Those major metropolitan statistical areas (MSAs) with a population greater than 1 million that saw the greatest number of REOs in July 2024 included: New York, NY (271 REOs); Chicago, IL (136 REOs); San Francisco, CA (104 REOs); Detroit, MI (100 REOs); and Los Angeles (97 REOs).

Copyright © 2024 BridgeTower Media, The Mecklenburg Times. All rights reserved.

Wednesday, August 28, 2024

Redfin: Typical Down Payment Is a Record $67,500

 Nearly 3 in 5 U.S. buyers put down more than 10% of the purchase price with the goal of lowering mortgage payments. Many get money from family members to help.

SEATTLE – The typical down payment for U.S. homebuyers hit a record high of $67,500 in June, up 14.8% from $58,788 a year earlier, according to a new report from the real estate brokerage Redfin. This was the 12th consecutive month the median down payment rose year over year.

The nearly 15% jump in the median down payment significantly outpaced the increase in home prices, which were up 4% in June year over year. The increase is being influenced by the current market, where higher-priced, turnkey homes in desirable neighborhoods are more likely to sell. It’s also partly due to buyers putting down a higher percentage of the purchase price as a down payment.

“Investors are still coming in with all-cash offers on homes that need to be renovated. Traditional buyers are putting down large down payments to try and lower their mortgage payment,” said Annie Foushee, a Redfin agent in Denver. “These buyers will often utilize the help of family members to put down more than they could on their own.”

The typical homebuyer’s down payment was 18.6% of the purchase price in June, the highest level in over a decade and up from 15% a year earlier.

Nearly three in five (59.4%) homebuyers put down more than 10% of the purchase price in June, up from 56.6% a year earlier.

Down payments are increasing for a number of reasons:

  • Rising home prices: The median-priced U.S. home was a record $442,525 in June, up 4% year over year. Higher home prices naturally lead to a higher down payment, which is a percentage of the home price.
  • Elevated mortgage rates: Homebuyers are incentivized to put down more money upfront, and borrow less, when mortgage rates are higher. The 6.92% average mortgage rate in June was among the highest in the past 20 years, pushing buyers to increase their down payment to minimize monthly payments.
  • Buyers have more equity: With home prices up, people who sell their previous property for more than they purchased it can use the extra equity for a larger down payment on their new home.
  • All-cash purchases make up nearly a third of home sales.

The percentage of U.S. home purchases made with all cash rose to 30.7% in June, up slightly from 30.4% a year ago.

“The percentage of all-cash sales generally follows the same trend as the rise and fall of mortgage rates. When rates are down, the percentage of all-cash sales is down too, and the opposite is true when rates go up,” said Redfin Senior Economist Sheharyar Bokhari. “That means we may start to see all-cash purchases level off a little now that mortgage rates have started to come down from recent highs.”

FHA loans fall to lowest level in nearly two years

FHA loans made up 13.7% of mortgaged U.S. home sales in June, the smallest share since August 2022 and down from 14.9% a year earlier. FHA loans have declined because home prices are at near-record highs and mortgage rates are still elevated, meaning fewer relevant buyers are able to afford a home.

VA loans made up 6.7% of all mortgaged home sales, down slightly from 6.9% a year earlier.

Conventional loans – the most common type – represented nearly four out of every five loans (79.5%) in June, up slightly from 78.2% a year ago. Jumbo loans – used for higher loan amounts and popular among luxury buyers – represented 6.6% of mortgaged sales, essentially unchanged from 6.5% a year earlier.

Metro-level highlights: June 2024

Metros with biggest increases/decreases in down payments, in dollars

In Newark, NJ, the median down payment jumped 51.5% to $125,000 from $82,500 a year ago 51.5% – the largest percentage increase among the metros Redfin analyzed. Next came Las Vegas (up 40.7% from $32,328 to $45,500), Washington, D.C. (up 38.7% from $54,800 to $76,000), New Brunswick, NJ (up 32.7% from $93,625 to $124,213) and Nashville, TN (up 32% from $46,500 to $61,395).

Down payments only fell in three metros: Jacksonville, FL (down 28.4% from $39,950 to $28,338), Oakland, CA ( down 11% from $219,000 to $195,000) and Tampa, FL (down 6.4% from $42,500 to $39,773).

Metros with highest/lowest down payments, in percentages

In San Francisco, the median down payment was equal to 25.8% of the purchase price – the highest among the metros Redfin analyzed. It was followed by San Jose, CA (25.7%) and Anaheim, CA (25%). Down payment percentages are typically higher in San Francisco’s Bay Area due to a higher concentration of wealthy residents who can afford to put a higher percentage of the purchase price down.

Down payment percentages were lowest in Virginia Beach, VA (3%) – an area with a higher concentration of veterans using VA loans with little to no down payment – followed by Detroit (6.8%), and Jacksonville, FL(8.6%).

Metros where all-cash purchases are most/least common

In West Palm Beach, FL, 50.4% of home purchases were made in cash – the highest share among the metros Redfin analyzed – followed by Riverside, CA (39.9%) and Detroit (38.9%). All three metros see strong investor activity.

All-cash purchases were least common in San Jose, CA (18.3%), Seattle (21%) and Oakland (21.2%) – three more expensive metros where the median-priced home tops $850,000.

Metros with biggest increases/decreases in share of all-cash purchases

In Pittsburgh, PA, 28.6% of home purchases were made in cash, up from 19.2% a year earlier – the largest increase among the metros Redfin analyzed. Next came New Brunswick, NJ (up from 31.1% to 36.8%) and Newark, NJ (up from 25.9% to 31.6%).

In Providence, RI, 23.1% of home purchases were made in cash, down from 33.5% a year earlier – the lowest increase among the metros Redfin analyzed. Next came Baltimore (down from 36.1% to 26.8%) and Jacksonville, FL (down from 44.2% to 38.1%).

© 2024 Florida Realtors®

FHFA: U.S. Home Prices Up 5.7% in Last Year

 Home prices across the nation were up 0.9% from Q1 2024. Florida has seen a 4.8% four-quarter appreciation and 79.3% five-year appreciation.

WASHINGTON – U.S. house prices rose 5.7% between the second quarter of 2023 and the second quarter of 2024, according to the Federal Housing Finance Agency (FHFA) House Price Index (FHFA HPI). House prices were up 0.9% compared to the first quarter of 2024. FHFA’s seasonally adjusted monthly index for June was down 0.1% from May.

“U.S. house prices saw the third consecutive slowdown in quarterly growth,” said Dr. Anju Vajja, deputy director for FHFA’s Division of Research and Statistics. “The slower pace of appreciation as of June end was likely due to higher inventory of homes for sale and elevated mortgage rates.”

Significant findings

Nationally, the U.S. housing market has experienced positive annual appreciation each quarter since the start of 2012.

House prices rose in 50 states and the District of Columbia between the second quarter of 2023 and the second quarter of 2024. The five states with the highest annual appreciation were 1) Vermont, 13.4%; 2) Virginia, 12.3%; 3) Rhode Island, 10.1%; 4) Delaware, 10.0%; and 5) New Jersey, 9.9%.

House prices rose in 96 of the top 100 largest metropolitan areas over the last four quarters. The annual price increase was the greatest in Syracuse, NY at 14.2%. The metropolitan area that experienced the most significant price decline was Austin-Round Rock-Georgetown, TX at -3.2%.

All nine census divisions had positive house price changes year-over-year.

The Middle Atlantic division recorded the strongest appreciation, posting a 8.5% increase from the second quarter of 2023 to the second quarter of 2024. The West South Central division recorded the smallest four-quarter appreciation, at 2.8%.

In Florida:

One-quarter appreciation:             0.3%

Four-quarter appreciation:             4.8%

Five-year appreciation:                  79.3%

Appreciation since 1991:               460.1%

The FHFA HPI is a comprehensive collection of publicly available house price indexes that measure changes in single-family home values based on data that extend back to the mid-1970s from all 50 states and over 400 American cities. It incorporates tens of millions of home sales and offers insights about house price fluctuations at the national, census division, state, metro area, county, ZIP code, and census tract levels. FHFA uses a fully transparent methodology based upon a weighted, repeat-sales statistical technique to analyze house price transaction data.

© 2024 Florida Realtors®

Monday, August 19, 2024

In the South, new home construction starts are 5.4% lower

 Summer Housing Slowdown Continues

In the South, new home construction starts are 5.4% lower year-to-date, and permits have decreased by 0.3% over the same period

WASHINGTON – Overall housing starts decreased 6.8% in July thanks, in part, to high interest rates for construction and development loans, labor shortages and higher prices for building materials, the National Association of Home Builders said.

Starts decreased to a seasonally adjusted annual rate of 1.24 million units, according to a report from the U.S. Department of Housing and Urban Development and the U.S. Census Bureau. This is the lowest pace since May 2020.

The July reading of 1.24 million starts is the number of housing units builders would begin if development kept this pace for the next 12 months. Within this overall number, single-family starts decreased 14.1% from an upwardly revised June figure to an 851,000 seasonally adjusted annual rate. However, on a year-to-date basis, single-family starts are up 11.4%. The multifamily sector, which includes apartment buildings and condos, increased 14.5% to an annualized 387,000 pace.

“The decline in new home construction mirrors our latest builder surveys, which show that buyers remain concerned about challenging affordability conditions and builders are grappling with elevated rates for builder loans, a shortage of workers and lots, and supply chain concerns for some building materials,” said Carl Harris, chairman of the National Association of Home Builders (NAHB) and custom home builder from Wichita, Kan.

“Better inflation data points to the Federal Reserve moving to cut interest rates possibly as early as September, and with interest rates expected to moderate in the months ahead, this will help both buyers and builders who are dealing with tight lending conditions,” said NAHB Chief Economist Robert Dietz.

On a regional and year-to-date basis, combined single-family and multifamily starts are 1.3% lower in the Northeast, 5.1% lower in the Midwest, 5.4% lower in the South and 5.1% lower in the West.

Overall permits decreased 4.0% to a 1.40 million unit annualized rate in July. Single-family permits decreased 0.1% to a 938,000 unit rate. Multifamily permits decreased 11.1% to an annualized 458,000 pace.

Looking at regional data on a year-to-date basis, permits are 1.1% higher in the Northeast, 3.2% higher in the Midwest, 0.3% lower in the South and 4.1% lower in the West.

Single-family homes under construction fell back to a count of 653,000 – down 4.1% compared to a year ago. The number of multifamily units under construction fell to an 886,000 count – down 13.2% compared to a year ago. The number of multifamily units under construction is now the lowest since July 2022.

Selma Hepp, CoreLogic chief economist, remains hopeful rate cuts will improve starts and permits.

"We expect housing starts and building permits to increase as we approach an official Fed interest rate cut. This prolonged high-interest-rate period has also negatively impacted recent homebuilder confidence. These negative sentiments are already improving through August's early indicators and should see a slight boost month on month going into 2024,” Hepp said.

© 2024 Florida Realtors®

Zillow: Lower Rates May Revive Competition

 Buyers in Florida’s bigger metros gained an upper hand in July 2024, Zillow said. Nationwide, homes have been lingering on the market longer compared to last year.

SEATTLE – Competition for homes and price appreciation tapered off faster than normal in July as high housing costs continued to stymie shoppers, according to the Zillow market report. But recent drops in mortgage rates should spur more competition as we head into fall.

"If this relief from mortgage rates continues, we should see more buyers restarting their hunt for a home," said Zillow Chief Economist Skylar Olsen. "But although rate lock among homeowners is easing, they probably won't be as motivated to jump back into the market and sell. With housing inventory still scarce, this improved affordability picture could reignite competition and sales as we head into the fall, or at least delay the usual post-summer cooldown."

Sellers lose the upper hand

Sellers gave up a marked advantage over buyers in July on the national scale, as the Zillow market heat index moved into neutral territory for the first time since December. This marks the first July the national market has been neutral since 2019; in each of the past two years, the market moved into neutral ground in October.

Among major markets, Denver, Pittsburgh, Indianapolis and Louisville lost their advantage for sellers and moved into neutral territory, while Orlando became buyer-friendly like the rest of the big Florida metros.

Homes are lingering on the market – even successful listings took almost a week longer to sell in July than last year. While that's still five days faster than the average pace of sales in the years before the pandemic, it's still a sign that buyers were much less eager to commit.

Inventory accumulated further in July, and now stands nearly 25% above last year's levels, marking the eighth straight month the year-over-year inventory gap has widened. Compared to pre-pandemic norms, the inventory shortfall shrank a bit and is now down 31.5%, the smallest deficit since October 2020.

In an effort to win over cash-strapped buyers, home sellers again cut prices at record levels. More than 26% of homes on Zillow received a price cut in July, the highest share for any July since at least 2018, when the dataset began.

What happens next?

This cooling competition and pricing slowdown could dissipate in August if lower mortgage rates hold.

By the end of July, lower rates brought the monthly price premium to buy a home, rather than rent a similar property, below $200.3 That has shrunk from a $247 difference as recently as April. Now lower rates in August are closing the gap even further.

Of course, the cost disparity between renting and buying differs in every metro and even by neighborhood. But for those shoppers on the edge of affordability – and who have enough cash on hand for a down payment – the significant drop in rates may offer enough relief to entice a move. The effect of a rate cut on mortgage payments is more significant in expensive areas.

Lower rates aren't likely to encourage a comparable wave of current homeowners to sell, though. Zillow surveys show 80% of recent sellers were influenced by major life events, such as a change in their household size or working situation. New listings typically surge in spring and then taper off as homeowners aim to sell, buy another house, and be moved in before school and the fall holidays begin.

Home value appreciation slowed to a refreshingly reasonable 2.8% year over year in July, but that could tick back up if the surge in demand outweighs an increase in supply, as expected.

Zillow's July home value index

© 2024 Florida Realtors

Wednesday, August 14, 2024

Asking Rents Fall in Florida, Nationwide

A Redfin study confirms a recent Zillow report finding: Rents are cooling. Some Florida cities with a high number of new apartments continue to see price drops.

SEATTLE – The median asking rent fell across all bedroom counts in July year over year, the first time that’s occurred since June 2020. That’s according to a new report from the real estate brokerage Redfin.

Median asking rents for 0-1 bedroom apartments fell 0.1% (to $1,498 a month), 2 bedroom apartments fell 0.3% (to $1,730) and 3+ bedroom apartments fell 2.4% (to $2,010). All three categories are down at least $50 from all-time highs posted in the last two years.

Prices remained steady for 0-1 bedroom and 2 bedroom apartments due to higher demand in those categories, even with increased supply coming onto the market. The increased supply of 3+ bedroom apartments, however, led to prices falling faster in July due to lower demand for larger, more expensive units which also compete against single-family home rentals.

The overall rental vacancy rate has remained at 6.6% for four consecutive quarters, the highest level since 2021, while the vacancy rate for buildings with 5+ apartments – the subject of Redfin’s report – was at 7.8% in the second quarter, up from 7.4% a year earlier.

“Rents have recently steadied – or even dropped slightly – because of the sheer number of apartments built over the past two years,” said Redfin Senior Economist Sheharyar Bokhari. “Construction is slowing down and prices will eventually start rising again, but now is still a good time for renters to find a deal, especially families looking for an apartment with at least three bedrooms.”

Nationwide median asking rent rises slightly, but still down $53 from all-time high

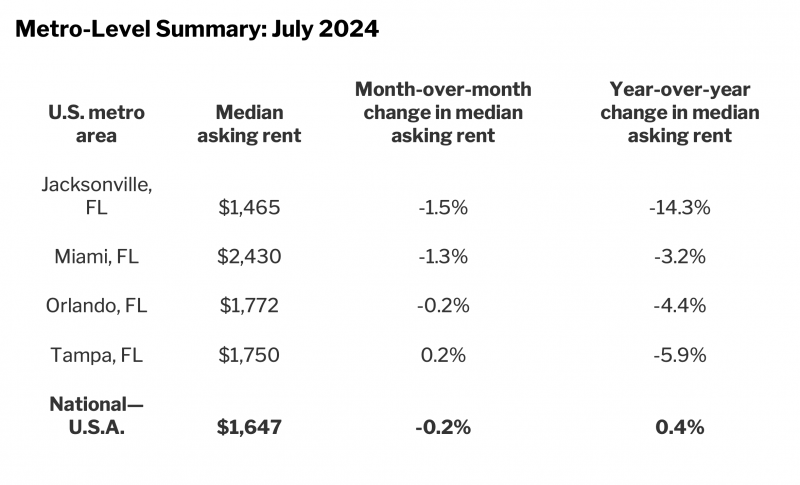
The median asking rent for all bedroom counts combined actually rose 0.4% year over year in July to $1,647. This discrepancy between the combined result (showing a gain) and the three different bedroom types (which all fell) is the result of a statistical phenomenon known as Simpson’s paradox.

The national median asking rent was down 0.2% month over month from June and $53 less than the all-time high of $1,700 recorded in August 2022. Despite the slight dip, affordability is still a serious issue for renter households, which earn roughly $11,000 less than is needed to afford a typical apartment.

Rents drop across Sun Belt, as East Coast and Midwest cities record big increases

Metro areas in Texas and Florida, two states which have built a high number of new apartments since the pandemic, continue to see large falls in price.

The median asking rent in Austin, TX dropped the most of any metro we analyzed in July, falling 16.9% year over year. Jacksonville, FL, was not far behind, with the median asking rent falling 14.3%.

San Diego (down 12.7%), San Francisco (down 7.6%) and Tampa, FL (down 5.9%) rounded out the five metros with the biggest drops in asking rents.

The median asking rent in Virginia Beach, VA rose 13.7% year over year in July, the biggest jump among the metros Redfin analyzed. Baltimore, MD (up 12.5%), Washington, D.C. (up 11.6%), Chicago (up 10.3%) and Cincinnati, OH (up 9.9%) posted the next highest gains.

Rental price declines in Florida

© 2024 Florida Realtors®