South Florida Inventory Search

South Florida Inventory Search
Click to Search the Complete South Florida Property Inventory

Wednesday, March 31, 2021

Jan. Home Prices Soared – Biggest Increase In Seven Years

 By Christopher Rugaber

S&P CoreLogic Case-Shiller: Prices rose 11.1% year-to-year in Jan., the biggest gain since March 2014. Prices rose in all 20 cities included in the report.

WASHINGTON (AP) – U.S. home prices increased at the fastest pace in seven years in January as the pandemic has fueled demand for single-family houses even as the supply for such homes shrinks.

The S&P CoreLogic Case-Shiller 20-city home price index, released Tuesday, rose 11.1% in January from a year earlier. That’s the biggest gain since March 2014. Prices rose in all 20 cities, and the 12-month increase was larger for all cities in January than in the previous month.

“January’s data remain consistent with the view that COVID has encouraged potential buyers to move from urban apartments to suburban homes,” said Craig Lazzara, managing director and global head of index investment strategy at S&P DJI. It’s not yet clear whether that trend will fade as the pandemic is brought under control, Lazzara said, or if there will be a permanent shift higher in demand.

The biggest price gain was in Phoenix, where home prices jumped 15.8%, followed by Seattle, with a 14.3% gain, and San Diego, at 14.2%.

Home sales have jumped in the past year, driven by a desire for more space among those Americans fortunate enough to keep their jobs. With roughly one-quarter of workers doing their jobs from home, along with children going to school online, families have sought out houses rather than apartments, or moved to larger homes.

Yet that trend has run into a reluctance among many Americans to sell their homes – and have legions of potential buyers parade through their living rooms – during the pandemic.

The number of available homes collapsed nearly one-third by February compared with a year earlier, to just over 1 million, according to the National Association of Realtors®. That’s the sharpest yearly drop on records dating back to 1982.

Higher mortgage rates may slow sales a bit in the coming months, but borrowing costs remain near historic lows. The average rate on a 30-year fixed mortgage rose to nearly 3.2% last week, the highest since June, up from 3.1% the week before. That’s still below the pre-pandemic rate of 3.5%.

Sales of new and existing homes fell sharply in February, mostly because of unseasonably cold winter weather and ice storms in Texas and other southern states. Yet existing home sales were still 9% higher in February compared with a year ago.

Copyright 2021 The Associated Press. All rights reserved. This material may not be published, broadcast, rewritten or redistributed without permission.

Tuesday, March 23, 2021

U.S. Home Sales Down, Prices Way Up

By Kerry Smith. 

Feb. existing home sales fell 6.6% month-to-month, but they were up 9.1% year-to-year. Median prices, however, rose 15.8% higher when compared to Feb. 2020.

WASHINGTON – Existing-home sales declined in February, following two prior months of gains, according to the National Association of Realtors® (NAR). The decline – along with an increase in home prices – directly relate to an all-time low in the number of homeowners opting to put their house on the market.

Month-over-month, only one major U.S. region tracked by NAR saw an increase in February, though all four regions recorded year-over-year gains.

Total existing-home sales – completed transactions that include single-family homes, townhomes, condominiums and co-ops – decreased 6.6% from January to a seasonally-adjusted annual rate of 6.22 million in February. But sales climbed year-over-year, up 9.1% from 5.70 million in February 2020.

“Despite the drop in home sales for February – which I would attribute to historically-low inventory – the market is still outperforming pre-pandemic levels,” says Lawrence Yun, NAR’s chief economist.

He cautioned of a possible slowdown in growth in the coming months as higher prices and rising mortgage rates will cut into home affordability.

“I still expect this year’s sales to be ahead of last year’s, and with more COVID-19 vaccinations being distributed and available to larger shares of the population, the nation is on the cusp of returning to a sense of normalcy,” Yun says. “Many Americans have been saving money, and there’s a strong possibility that once the country fully reopens, those reserves will be unleashed on the economy.”

The median existing-home price for all housing types in February was $313,000, up 15.8% from February 2020 ($270,400). February’s national price jump marks 108 straight months of year-over-year gains.

“Home affordability is weakening,” Yun says. “Various stimulus packages are expected and they will indeed help, but an increase in inventory is the best way to address surging home costs.”

According to Freddie Mac, the average commitment rate for a 30-year, conventional, fixed-rate mortgage was 2.81% in February, up from 2.74% in January. The average commitment rate across all of 2020 was 3.11%.

Total housing inventory at the end of February amounted to 1.03 million units, equal to January’s inventory and down 29.5% from one year earlier (1.46 million). Unsold inventory sits at a 2.0-month supply at the current sales pace, slightly up from January’s 1.9-month supply and down from the 3.1-month amount recorded in February 2020. NAR first began tracking the single-family home supply in 1982.

Properties typically remained on the market for 20 days in February, down from 21 days in January and from 36 days in February 2020. Three out of four (74%) homes sold in February 2021 were on the market for less than a month.

First-time buyers made up 31% of February’s sales, down from 33% in January and from 32% in February 2020.

Individual investors or second-home buyers, who account for many cash sales, purchased 17% of homes in February, up from 15% in January and equal to the percentage from February 2020. All-cash sales accounted for 22% of transactions in February, up from 19% in January and 20% in February 2020.

Distressed sales – foreclosures and short sales – represented less than 1% of sales in February, equal to January’s percentage but down from 2% in February 2020.

Single-family and condo/co-op sales: Single-family home sales decreased to a seasonally adjusted annual rate of 5.52 million in February, down 6.6% from January, and up 8.0% from one year ago. The median existing single-family home price was $317,100 in February, up 16.2% from February 2020.

Existing condominium and co-op sales were at a seasonally-adjusted annual rate of 700,000 units in February, down 6.7% from January and up 18.6% from one year ago. The median existing condo price was $280,500 in February, an increase of 12.3% year-to-year.

Regional breakdown: Compared to one year ago, median home prices increased in each of the four major regions tracked by NAR.

February 2021 saw existing-home sales in the Northeast fall 11.5%, recording an annual rate of 770,000, though it’s a 13.2% increase from a year ago. The median price in the Northeast was $356,000, up 20.5% from February 2020.

Existing-home sales in the Midwest dropped 14.4% to an annual rate of 1,310,000, a 2.3% rise from a year ago. The median price in the Midwest was $231,800, a 14.2% climb from February 2020.

Existing-home sales in the South decreased 6.1%, posting an annual rate of 2,770,000 in February, up 9.9% from the same time one year ago. The median price in the South was $271,200, a 13.6% increase from a year ago.

Existing-home sales in the West rose 4.6% from the month prior, recording an annual rate of 1,370,000 in February, a 12.3% jump from a year ago. The median price in the West was $493,300, up 20.6% from February 2020.

© 2021 Florida Realtors®

Florida's Housing Market: More Sales, Higher Median Prices in Feb. 2021

By Marla Martin

 Florida Realtors’ data: Single-family home sales rose 15.7% year-over-year, median sales price up 16.6%; condo sales up 28.7%, median price up 16.6%. Chief Economist O’Connor: Fewer new listings and a tight inventory means a strong seller’s market.

ORLANDO, Fla. – Amid increased COVID-19 vaccinations and hopeful signs for the future, Florida’s housing market in February reported more closed sales, higher median prices, more new pending sales and increased pending inventory in February 2021 compared to a year ago, according to Florida Realtors® latest housing data. Single-family existing home sales rose 15.7 % compared to February 2020.

“Florida’s housing market continued its momentum in February, but higher interest rates could be a factor going forward,” says 2021 Florida Realtors President Cheryl Lambert, broker-owner with Only Way Realty Citrus in Inverness. “While rising rates could potentially slow the pace of home sales, rates remain relatively low by historical standards. Record-low inventory is continuing to put pressure on home prices to rise and creates challenges for buyers. However, new pending sales rose 10.9% for single-family existing homes last month compared to February 2020, while new pending sales for condo-townhouse units increased 35.4% year-over-year.”

Closed sales of single-family homes statewide in February totaled 23,947, up 15.7% year-over-year, while existing condo-townhouse sales totaled 11,379, up 28.7% over February 2020. Closed sales may occur from 30- to 90-plus days after sales contracts are written.

The statewide median sales price for single-family existing homes was $314,900, up 16.6% from the previous year, according to data from Florida Realtors Research Department in partnership with local Realtor boards/associations. Last month’s statewide median price for condo-townhouse units was $233,240, up 16.6% over the year-ago figure. The median is the midpoint; half the homes sold for more, half for less.

Florida Realtors Chief Economist Dr. Brad O’Connor notes that Florida’s current housing market is a strong seller’s market, with fewer new listings and a very tight inventory (active listings), particularly for single-family existing homes.

He says, “The statewide inventory of active single-family home listings, which Florida Realtors has been tracking since January 2008, is currently at an all-time low. At the end of February, single-family inventory was down 56.3% compared to a year ago. Most of this decline has been a result of our ultra-high rate of sales.

“However, so far in 2021, new listings of single-family homes have not kept up with their pace of 12 months ago. In February, they were down 4.9% year-over-year, which is an improvement over January, but still represents a move in the wrong direction. There’s a likelihood that much of this decline has been due to some sellers, who in normal times might have listed in January or February, instead listing ahead of 2021 in response to the unusually strong market in the second half of 2020. But there’s also the possibility that a small but increasing number of homeowners, who have been thinking of selling their current home and buying another one, are starting to get turned off by the lack of available inventory and the rising prices that have resulted from it.”

The condo-townhouse category shows a slightly different picture, O’Connor says.

“In February, closed sales in this category rose 28.7% year-over-year, which is consistent with the growth rates we’ve been seeing each month going back to September,” he says. “Some of this growth is likely being fueled by frustrated buyers who had their hearts set on a single-family home finally giving up and settling for an attached unit instead, but we’re also seeing high demand from folks with the typical condo- and townhouse-buyer profile, as well. And while inventory in this category is still high relative to what we’re seeing in the single-family home category, it was down 34.4% compared to a year ago.”

On the supply side of the market, inventory (active listings) remained constrained in February. Single-family existing homes were at a very restricted 1.3-months’ supply while condo-townhouse inventory was at a 3.4-months’ supply.

According to Freddie Mac, the interest rate for a 30-year fixed-rate mortgage averaged 2.81% in February 2021, significantly lower than the 3.47% averaged during the same month a year earlier.

To see the full statewide housing activity reports, go to Florida Realtors Tools and Research section. Realtors also have access to local market data (password protected) through Florida Realtors’ SunStats resource.

© 2021 Florida Realtors®

Monday, March 22, 2021

New-Home Costs Skyrocketing – and Not Just Due to Lumber

 While lumber costs deserve a lot of the blame for the rising price of new homes, other things – crude oil (paint), drywall, ceramic tile – are also more expensive.

NEW YORK – The U.S. Bureau of Labor Statistic’s producer-price index reveals record prices for granite, insulation, concrete blocks and common brick for 2021. And as the prices for raw materials used to build homes rises, so do the costs of homes and home improvement projects.

Lumber, one of the biggest costs in homebuilding after land and labor, has never been more expensive at more than twice the typical price for this time of year.

Crude oil, a starting point for paint, drain pipes, roof shingles and flooring, has shot up more than 80% since October.

Copper – used for waterpipes in many homes – costs about a third more than it did in the autumn. Drywall and ceramic tiles are short of record prices but have also climbed.

The National Association of Home Builders says rising lumber prices alone have added $24,000 to the cost of building the average single-family home and about $9,000 per apartment.

On the plus side, rock-bottom mortgage rates have made homeownership more affordable, and lower household spending during the lockdown and federal stimulus checks have helped people accumulate down payments. Many, however, went on a remodeling bender further straining the U.S. supply of building materials. Overall, Americans pocketed $152.7 billion from cash-out refinancings last year.

Due in part to the remodeling, building suppliers dealt with slowdowns during the lockdowns, but they haven’t been able to catch up, especially since building permits for residential construction are being issued at the highest rate since 2006.

Source: Wall Street Journal (03/17/21) Dezember, Ryan; Quiroz-Gutierrez, Marco

© Copyright 2021 INFORMATION INC., Bethesda, MD (301) 215-4688

Home Flipping – and Profit Margins – Lower in 2020


By Kerry Smith

The 2020 real estate market wasn’t ideal for home flippers who buy homes, fix them up and resell. ATTOM’s 2020 report found that fewer home flips were funded by fewer mortgages. And while gross profits went higher, profit margins dipped for the third straight year.

IRVINE, Calif. – ATTOM Data Solutions’ 2020 U.S. Home Flipping Report found 241,630 single family homes and condos flipped in the United States last year. That’s down 13.1% from 2019 and the lowest point since 2016.

The number represented 5.9% of all home sales in the nation, down from 6.3% in 2019 and the same percentage seen in 2018. It’s the first time since 2014 that both measures decreased annually.

Gross profits from flipping, however, increased – but profit margins did not. It’s the third straight year that returns on investments (ROI) declined.

Homes flipped in 2020 typically generated a gross profit of $66,300 – the difference between the median sales price and the median amount originally paid by investors – up 6.6% from $62,188 in 2019 and the highest point since at least 2005.

But the typical gross flipping profit translated into just a 40.5% ROI compared to the original acquisition price. The latest ROI (before accounting for mortgage interest, property taxes, renovation expenses and other holding costs) was down from 41.5% in 2019, 46.4% in 2018 and more than 10 percentage points lower than decade peaks in 2016 and 2017.

In Florida, Jacksonville stood out in two categories in ATTOM’s report. It made the top five list of “biggest annual flipping-rate increases” with an increase of 3.6%. However, it also made the list for “biggest decreases in profit margins” in the top spot, with ROI at 39.4% in 2020, down from 52.2% in 2019.

“Last year was a banner year for the U.S. housing market, with the apparent exception of the home-flipping business, which saw its fortunes slide a bit more in 2020,” says Todd Teta, chief product officer at ATTOM Data Solutions. “Home flippers did still make a nice profit on investments that generally take around six months to turn around – just not as much as they did in the previous few years. It’s too early to know if that small slide was a sign of weakness in the broader housing market or just a bump in the road. We will know much more as we gauge other key market metrics in the coming months.”

Flipping also involved fewer mortgages in 2020. The percentage of flipped homes purchased with financing dipped in 2020 to 41.7%, down from 42.3% in 2019 and 41.8% two years ago.

Meanwhile, 58.3% of homes flipped in 2020 were bought with all-cash, up from 57.7% in 2019 and from 58.2% in 2018.

ATTOM’s report also included data on just the fourth quarter of 2020:

  • The 51,993 home flips in the 4Q 2020 were completed by 43,929 investors, a ratio of 1.18 flips per investor.
  • The share of homes flipped purchased by investors with financing represented 42.7% of all homes flipped in the quarter, up from 42.3% in the previous quarter and 41.2% one year earlier
  • The median gross-flipping profit on home flips in the fourth quarter of 2020 was $70,500, which represented a typical 40.3% return on investment, down from 44.3% in the previous quarter and from 40.5% one year earlier
  • 2020 4Q home flips took an average of 176 days, up from 169 days in the fourth quarter of 2019

© 2021 Florida Realtors®

Monday, March 8, 2021

The average credit score for Miami mortgage loan applicants is....


Miami ranked 7th most in-demand city based on 2020 mortgage loans

by Jason Porterfield

 
Miami ranked 7th most in-demand city based on 2020 mortgage loans

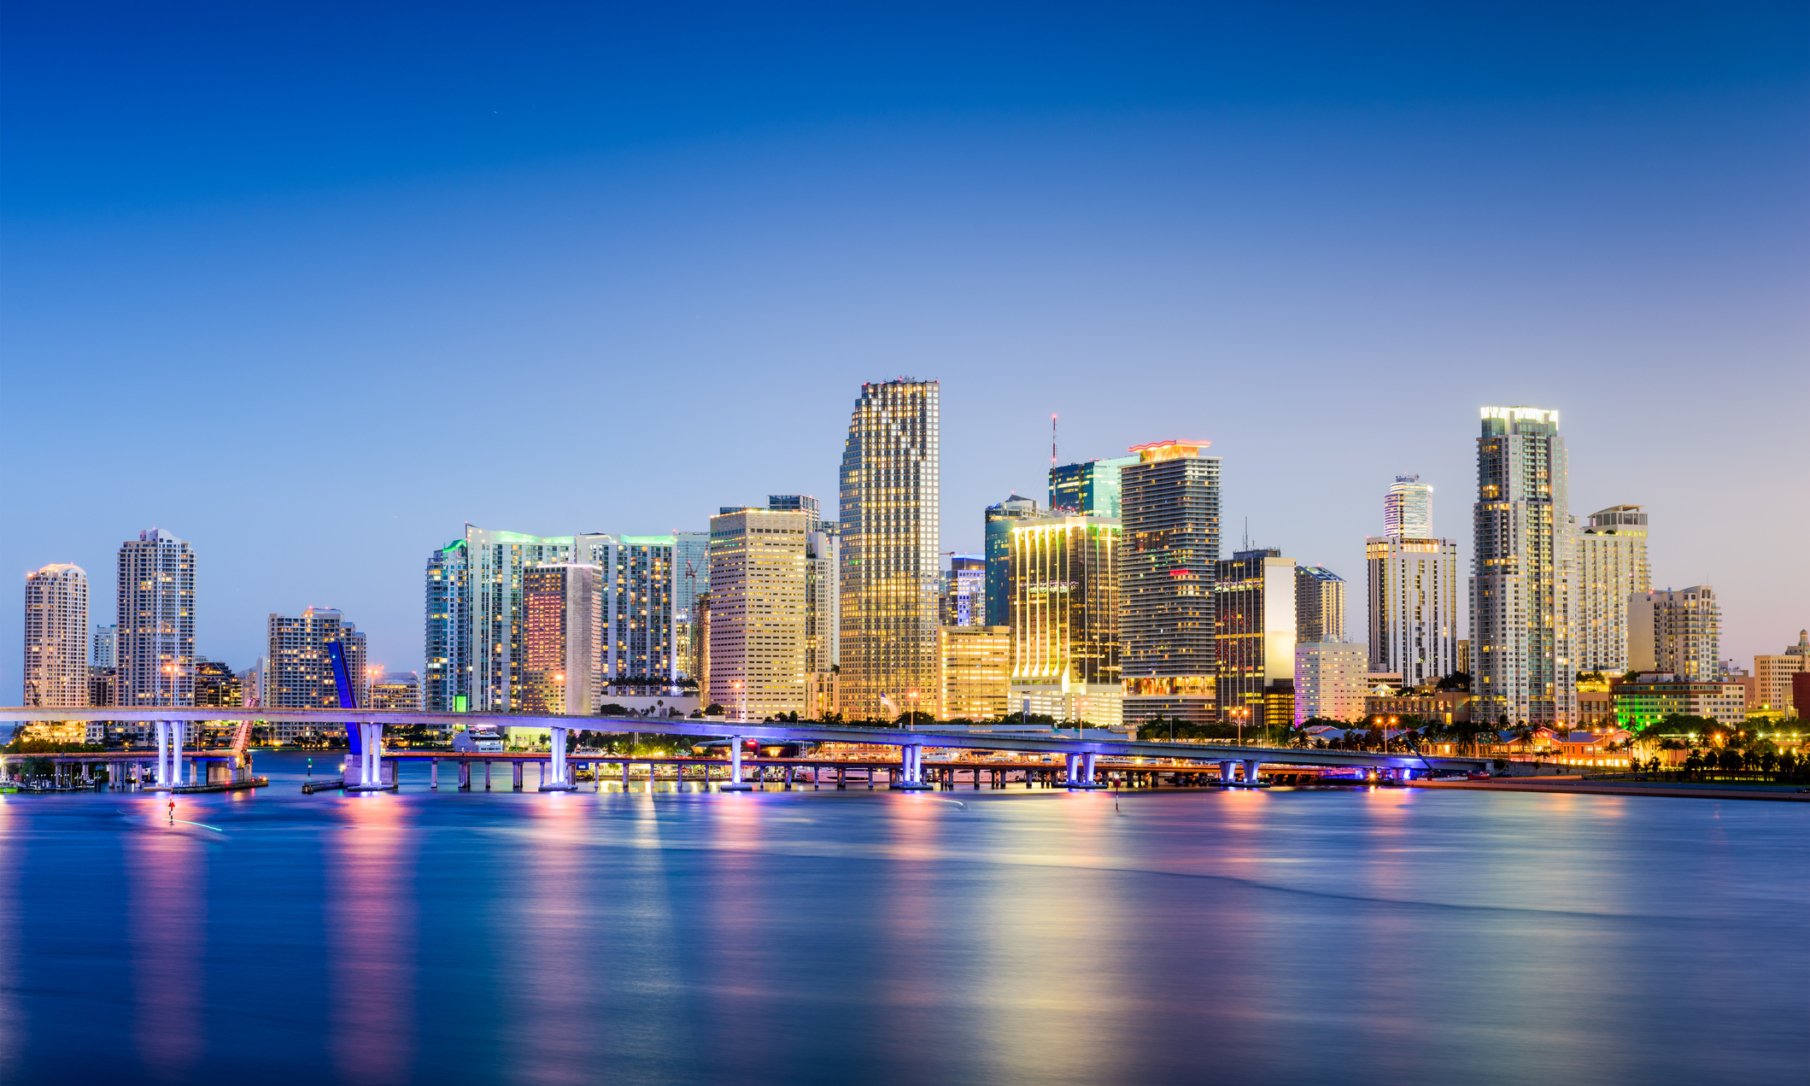
Miami, Florida, USA downtown skyline.

At a time of low home inventories, it helps to earn at least $100,000 annually when applying for a mortgage in high-demand cities such as South Florida, according to Rocket Mortgage.

The mortgage lender looked at the average salaries of successful applicants in each city, their average FICO credit scores, the average size of their loan requests and the median list price for that location.

In Miami, the average annual salary for obtaining a mortgage was $120,555. Miami applicants had an average credit score of 742 and asked for loans averaging $279,317. The median list price for homes in the Miami market was $479,150. Rocket Mortgage ranked Miami the seventh-most in-demand city based on the number of mortgage loans closed last year.

The average annual salary for successful applicants fell below $100,000 in just three cities on Rocket Mortgage’s list: Phoenix, AZ ($99,417); San Antonio, TX ($94,550); and Tucson, AZ ($84,958).

The other cities on the list are: Las Vegas, NV ($100,912); Houston, TX ($122,400); Charlotte, NC ($106,914); Miami, FL ($120,555); Denver, CO ($112,740); Chicago, IL ($126,256); and San Diego, CA ($139,282).

Las Vegas was the most in-demand city based on Rocket Mortgage’s data, followed by Phoenix and Houston. Charlotte ranked forth and San Antonio rounded out the top five. Tucson was sixth, then Miami, Denver, Chicago and San Diego. The lowest median list price was $270,064 in Tucson and the highest was $691,928 in San Diego.

Tucson had the lowest average loan request at $207,601. San Diego had the highest, at $403,327. San Diego applicants also had the highest average credit score, at 766. Denver (755) and Las Vegas (751) were the only other cities where applicants average credit scores above the 750-point threshold for an “excellent” rating. Miami and Charlotte tied for the lowest average score among the 10 most in-demand cities at 742.